FIGURE SUMMARY
Title

Endoglin is a conserved regulator of vasculogenesis in zebrafish-Implications for hereditary haemorrhagic telangiectasia

Authors
Zhang, D., Zhou, F., Zhao, X., Liu, B., Chen, J., Yang, J.
Source
Full text @ Biosci. Rep.

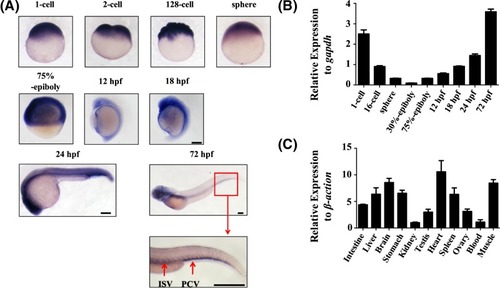
Temporal-spatial expression of endoglin

(A) Embryonic zebrafish endoglin expression by WISH (n>30 for each group). Embryo stages, as labelled, are shown in lateral views from the 1 cell to 72 hpf stage. Blue staining shows a positive signal for endoglin expression and the red box indicates high expression of endoglin in the tail region. Scale bars are 200 μm. (B) qPCR analysis of endoglin expression in different stages of zebrafish embryos from the 1-cell to 72 hpf stage. Gapdh was used as an internal control (mean ± SD; the experiments were repeated three times). (C) The mRNA level of endoglin in various tissues of the adult zebrafish, including the intestine, liver, brain, stomach, kidney, testis, heart, spleen, ovary, blood and muscle. β-Actin was used as an internal control (mean ± SD; the experiments were repeated three times).

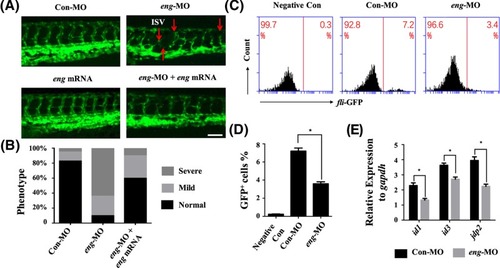
Endoglin knockdown affected the development of the vasculature

(A) 72 hpf Tg(fli1a:EGFP)y1 transgene zebrafish embryos were selected to demonstrate the phenotypic change in the Con-MO, eng-MO, eng mRNA and eng-MO + eng mRNA group. (All Tg(fli1a:EGFP)y1 zebrafish embryos were injected with 2 ng morpholinos and 500 pg mRNA. For example, Con-MO group: 2 ng 5-mispair control MO and 500 pg mCherry mRNA). The red arrows point to the disrupted structure of ISVs. Scale bars are 100 μm. (B) Quantification of phenotypic defects in the Con-MO, eng-MO and eng-MO + eng mRNA group (Normal: most vascular and intersegmental blood vessels do not have obvious defects; Mild: most vascular vessels do not have obvious defects, but some intersegmental blood vessels are twisted and defective; Severe: most vascular and intersegmental blood vessels are disrupted, and some intersegmental blood vessels have disappeared). (C) FACS analysis of fli-GFP+ cells in the 24 hpf Negative Con, Con-MO and eng-MO groups (Negative Con: AB zebrafish injected with 5-mispair control MOs; Con-MO: Tg(fli1a:EGFP)y1 zebrafish injected with 5-mispair control MOs; eng-MO: Tg(fli1a:EGFP)y1 zebrafish injected with endoglin MOs). (D) Quantification of fli-GFP+ cell number from FACS analysis (mean ± SD; the experiments were repeated three times). (E) qPCR analysis of endoglin downstream gene expression in 24 hpf zebrafish embryos, including id1, id3 and jdp2. Gapdh was used as an internal control (mean ± SD; the experiments were repeated three times). A value of P was considered statistically significant (*P<0.05) for D and E.

EXPRESSION / LABELING:
Genes:
Fish:
Knockdown Reagent:
Anatomical Terms:
Stage Range: Prim-5 to Protruding-mouth
PHENOTYPE:
Fish:
Knockdown Reagent:
Observed In:
Stage Range: Prim-5 to Protruding-mouth

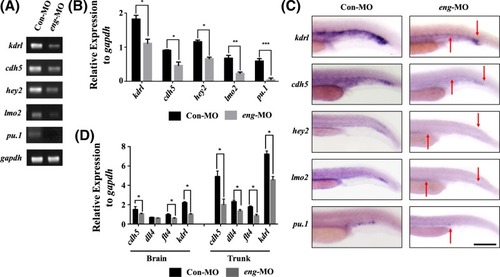
Endoglin knockdown decreased the expression of endothelial markers

(A) RT-PCR for endothelial markers in the Con-MO and eng-MO group, including kdrl, cdh5, hey2, lmo2 and pu.1 (A). Gapdh was used as an internal control. (B) Quantification of mRNA expression in (A) with grey scanning analysis, conducted with ImageJ. (C) WISH for endothelial marker expression in the Con-MO and eng-MO group among 24 hpf embryos (n>30 for each group). The red arrow indicates the region where the endothelial markers were significantly decreased. Scale bars are 200 μm. (D) qPCR for cdh5, dll4, flt4 and kdrl expression in the brain and trunk of the Con-MO and eng-MO group. Gapdh was used as an internal control (error bars, SEM; n=3 biological replicates). A value of P was considered statistically significant (*P<0.05, **P<0.01, ***P<0.001) for B and D.

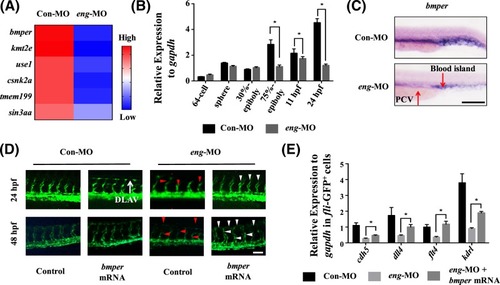
Bmper was involved in endoglin-regulated vasculogenesis

(A) Heat maps presenting part of the RNA-Seq result. Six vasculogenesis genes were significantly decreased after endoglin knockdown, including bmper, kmt2e, use1, csnk2a1, tmem199 and sin3aa. The level of expression of the gene is indicated with red (high) or blue (low). (B) qPCR analysis of bmper expression in different stages of the Con-MO and eng-MO group, including 64 cell, sphere, 30% epiboly, 75% epiboly, 11 hpf and 24 hpf stage. Gapdh was used as an internal control (mean ± SD; the experiments were repeated three times). (C) Bmper expression by WISH in 24 hpf zebrafish embryos of the Con-MO and eng-MO group. The red arrow indicates the region where the expression of bmper was significantly decreased. (D) Fluorescence image of Con-MO, Con-MO + bmper mRNA, eng-MO and eng-MO + bmper mRNA group. (All Tg(fli1a:EGFP)y1 zebrafish embryos were injected with 2 ng morpholinos and 500 pg mRNA. For example, Con-MO group: 2 ng 5-mispair control MO and 500 pg mCherry mRNA.) The red and white arrows point to the disrupted and rescued structure of DLAV and ISVs, respectively. (E) qPCR analysis for cdh5, dll4, flt4 and kdrl expression in fli-GFP+ cells of the Con-MO, eng-MO and eng-MO + bmper mRNA group. Gapdh was used as an internal control (mean ± SD; the experiments were repeated three times). A value of P was considered statistically significant (*P<0.05) for B and E. Scale bars are 100 μm for C and D.

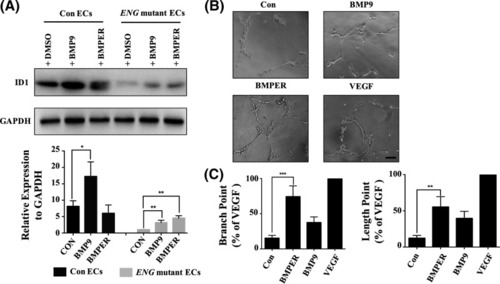
Enhancing the expression of BMPER increased the expression of ID1 and blood vessel formation in ENG mutant ECs

(A) Western blot analysis of ID1 expression in the Con ECs + 0.1% DMSO, Con ECs + 10 ng/ml BMP9, Con ECs + 20 ng/ml BMPER, ENG mutant ECs + 0.1% DMSO, ENG mutant ECs + 10 ng/ml BMP9 and ENG mutant ECs + 20 ng/ml BMPER group. Each group was incubated for more than 24 h at 37°C. GAPDH was used as an internal control. Grey scanning analysis, conducted using ImageJ, was used to analyse the Western blot results (mean ± SD; the experiments were repeated three times). (B) The tube formation of ENG mutant ECs in four groups, including the Con (EC(FULL)-SFM medium without 30 ng/ml VEGF), VEGF (EC(FULL)-SFM medium), BMP9 (EC(FULL)-SFM medium without 30 ng/ml VEGF + 10 ng/mL BMP9) and BMPER (EC(FULL)-SFM medium without 30 ng/ml VEGF + 20 ng/ml BMPER) group. Tube formation was assessed and photographed at 3 h. Scale bars are 100 μm. (C) Quantitative results of tube formation. The number and the length of branches were assessed and counted by Imagine J. The VEGF group was a positive control. The ratio of tube formation = (the number/full-length of branches in each group):(the number/ full-length of branches in VEGF group). Error bars represent the SD of the mean values from three independent experiments. A value of P was considered statistically significant (*P<0.05, **P<0.01, ***P<0.001) for A and C.

Acknowledgments
This image is the copyrighted work of the attributed author or publisher, and ZFIN has permission only to display this image to its users. Additional permissions should be obtained from the applicable author or publisher of the image. Full text @ Biosci. Rep.