IMAGE

Figure 6

ID
ZDB-IMAGE-190723-930
Source
Figures for Zhang et al., 2019
Image
Figure Caption

Figure 6

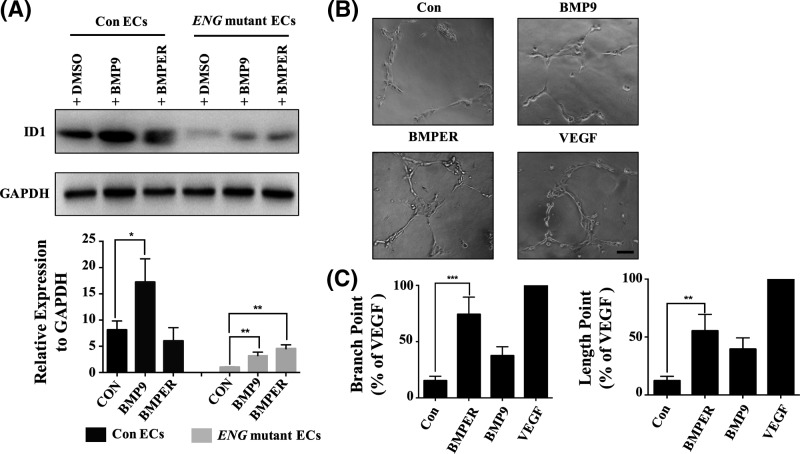
Enhancing the expression of BMPER increased the expression of ID1 and blood vessel formation in ENG mutant ECs

(A) Western blot analysis of ID1 expression in the Con ECs + 0.1% DMSO, Con ECs + 10 ng/ml BMP9, Con ECs + 20 ng/ml BMPER, ENG mutant ECs + 0.1% DMSO, ENG mutant ECs + 10 ng/ml BMP9 and ENG mutant ECs + 20 ng/ml BMPER group. Each group was incubated for more than 24 h at 37°C. GAPDH was used as an internal control. Grey scanning analysis, conducted using ImageJ, was used to analyse the Western blot results (mean ± SD; the experiments were repeated three times). (B) The tube formation of ENG mutant ECs in four groups, including the Con (EC(FULL)-SFM medium without 30 ng/ml VEGF), VEGF (EC(FULL)-SFM medium), BMP9 (EC(FULL)-SFM medium without 30 ng/ml VEGF + 10 ng/mL BMP9) and BMPER (EC(FULL)-SFM medium without 30 ng/ml VEGF + 20 ng/ml BMPER) group. Tube formation was assessed and photographed at 3 h. Scale bars are 100 μm. (C) Quantitative results of tube formation. The number and the length of branches were assessed and counted by Imagine J. The VEGF group was a positive control. The ratio of tube formation = (the number/full-length of branches in each group):(the number/ full-length of branches in VEGF group). Error bars represent the SD of the mean values from three independent experiments. A value of P was considered statistically significant (*P<0.05, **P<0.01, ***P<0.001) for A and C.

Acknowledgments
This image is the copyrighted work of the attributed author or publisher, and ZFIN has permission only to display this image to its users. Additional permissions should be obtained from the applicable author or publisher of the image. Full text @ Biosci. Rep.