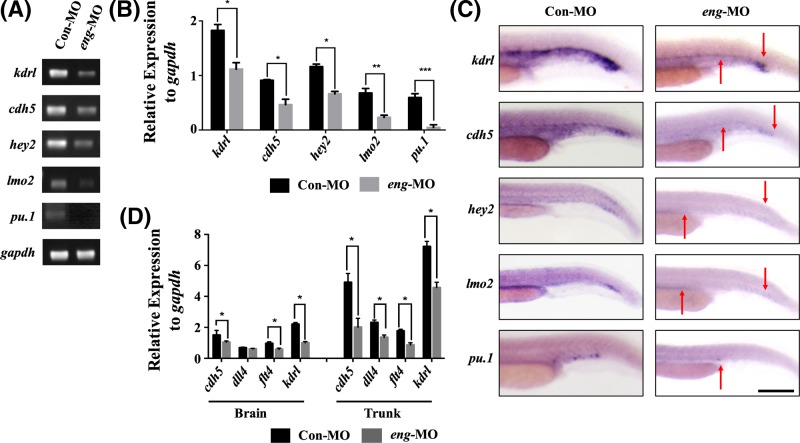
IMAGE

Figure 4

ID
ZDB-IMAGE-190723-928
Genes
Source
Figures for Zhang et al., 2019
Image
Figure Caption

Figure 4

Endoglin knockdown decreased the expression of endothelial markers

(A) RT-PCR for endothelial markers in the Con-MO and eng-MO group, including kdrl, cdh5, hey2, lmo2 and pu.1 (A). Gapdh was used as an internal control. (B) Quantification of mRNA expression in (A) with grey scanning analysis, conducted with ImageJ. (C) WISH for endothelial marker expression in the Con-MO and eng-MO group among 24 hpf embryos (n>30 for each group). The red arrow indicates the region where the endothelial markers were significantly decreased. Scale bars are 200 μm. (D) qPCR for cdh5, dll4, flt4 and kdrl expression in the brain and trunk of the Con-MO and eng-MO group. Gapdh was used as an internal control (error bars, SEM; n=3 biological replicates). A value of P was considered statistically significant (*P<0.05, **P<0.01, ***P<0.001) for B and D.

Figure Data
Acknowledgments
This image is the copyrighted work of the attributed author or publisher, and ZFIN has permission only to display this image to its users. Additional permissions should be obtained from the applicable author or publisher of the image. Full text @ Biosci. Rep.