
- Title
-
TNF signaling and macrophages govern fin regeneration in zebrafish larvae
- Authors
- Nguyen-Chi, M., Laplace-Builhé, B., Travnickova, J., Luz-Crawford, P., Tejedor, G., Lutfalla, G., Kissa, K., Jorgensen, C., Djouad, F.
- Source
- Full text @ Cell Death Dis.
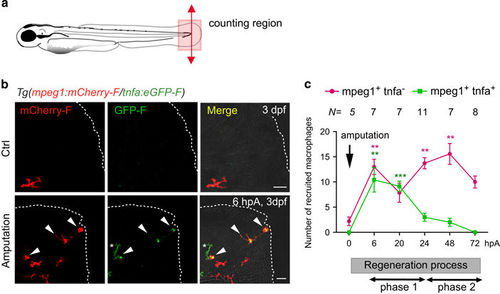
Tnfa+ and tnfa− macrophages are differentially recruited during caudal fin regeneration in zebrafish larvae. (a) Diagram showing the amputation plan (red arrow) and the counting region (pink box) in the 3 dpf larvae. (b) Caudal fin of Tg(mpeg1:mCherry-F/ tnfa:eGFP-F) were amputated at 3 dpf as shown in A and mCherry-F and GFP-F expressions were analyzed by confocal microscopy at 6 hpA in either intact (Ctrl) or amputated fins. Fin images are representative maximum projections of single fluorescence channels (mCherry-F, GFP-F) and overlay of fluorescences with transmitted light images (Merge). Arrowheads show mCherry-F+GFP-F+ cells and asterisk GFP-F+ cell, dotted lines outline the fin. Scale bar=20 μm. (c) Number of tnfa+ and tnfa− macrophages recruited to the wound region at indicated time points post amputation over 3 days. The number of larvae (N) used at each time point is indicated on the top of the graph. **P< 0.01 and ***P<0.001 indicated time point versus 0 hpA. Below the graph, a sketch of the different phases of recruitment of macrophage subsets: the M1-like macrophages accumulate during the early phase of regeneration (phase 1), whereas M2-like macrophages peaked at a later stage of the process (phase 2) EXPRESSION / LABELING:
|
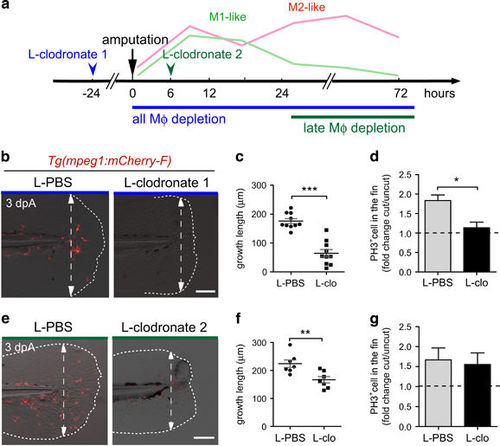
Macrophages are required for fin regeneration and blastemal cell proliferation in a stage-dependent manner. (a) Schedule of macrophage (Mφ) depletion using L-clodronate injections. Macrophages were ablated using early L-clodronate injections (L-clodronate 1; no macrophages at the wound) or using injection of L-clodronate at later stages (L-clodronate 2; no more recruited M2-like macrophages from 24 hpA). (b and e) Consequences of macrophage depletion on caudal fin regeneration. (b) To deplete all macrophages from the early stage of regeneration, Tg(mpeg1:mCherry-F) were injected with L-clodronate (or L-clo) or L-PBS (control) at 48 hpf and fin were transected at 72 hpf (L-clodronate 1). (e) To deplete late-recruited macrophages, Tg(mpeg1:mCherry-F) were injected with L-clodronate or L-PBS at 6 hpA (L-clodronate 2). Fin images are representative overlays of mCherry fluorescence and transmitted light acquisitions at 3 dpA. Scale bar=100 μm. Dotted lines outline the fin and dashed arrows, the position of the initial amputation. (c and f) Corresponding quantification of the regenerated fin length at 3 dpA after L-clodronate 1 treatment (c) and L-clodronate 2 treatment (f) in indicated conditions (mean±S.E.M., **P<0.01 and ***P<0.001). (d–g) Blastema cell proliferation at 24 hpA after L-clodronate 1 (d) and 2 (g) treatments in indicated conditions. Mitotic cells were detected using an anti-phosphorylated histone H3 (PH3) antibody (Nlarvae=10–15, average value of cut/uncut ratio±S.E.M, *P<0.05) |
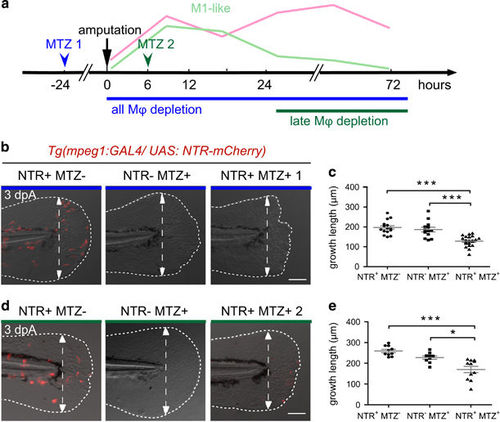
Genetic depletion of macrophages at different stages confirms the requirement of macrophages during fin regeneration. (a) Schedule of macrophage (Mφ) depletion using Tg(mpeg1:GAL4/UAS:NTR-mCherry) larvae and Metronidazol (MTZ) treatment. (b–e) Tg(mpeg1:GAL4/UAS:NTR-mCherry) larvae were treated with MTZ (NTR+ MTZ+) to deplete macrophages. DMSO treatments on the same line (NTR+ MTZ−) or MTZ treatments on WT siblings (NTR− MTZ+) were used as controls. (b) Treatments were performed from 48 hpf and fins were amputated at 3 dpf to deplete macrophages during the whole regeneration process (MTZ 1). (d) Treatments were performed from 6 hpA to deplete late macrophages (MTZ 2). Fin images are representative overlays of mCherry-F fluorescence (red) with transmitted light acquisitions at 3 dpA. Scale bar=100 μm. Dotted lines outline the fin; dashed arrows indicate the position of the initial amputation. (c and e) Corresponding quantification of the regenerated fin length at 3 dpA in MTZ 1 (c) and MTZ 2 treatments (e) in indicated conditions (mean±S.E.M. from three independent experiments, ***P<0.001 and *P<0.05) |
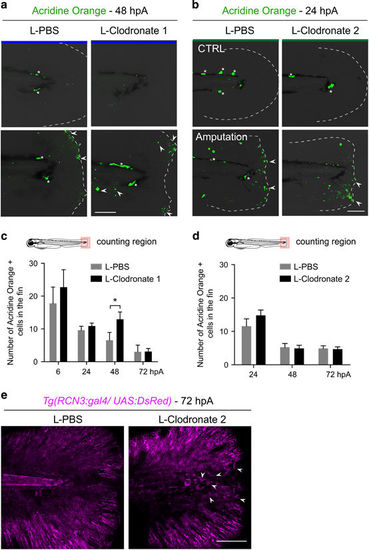
Depletion of late-recruited macrophages affects regeneration by impairing mesenchymal cell behavior but not cell death. (a and b) Representative images show cell death (green) in intact and amputated fin at (a) 48 hpA and (b) 24 hpA using confocal microscopy. (a) Cell death was detected using Acridine Orange staining in larvae in which all macrophages were depleted with L-clodronate treatment 24 h before amputation (L-clodronate 1) or not (L-PBS). (b) Cell death was detected using Acridine Orange staining in larvae in which late macrophages were depleted with L-clodronate treatment at 6 hpA (L-clodronate 2) or not (L-PBS). Dotted lines outline the fin, asterisks show autofluorescence of the pigments and arrowheads show dead cells. Scale bar=100 μm. (c,d) Cell death counts in indicated conditions (Nlarvae=7–18 per group from two independent experiments, mean values±S.E.M., *P<0.05). (e) Tg(rcn3:gal4/UAS:Ds-Red) larvae were amputated at 3 dpf and injected with either L-PBS or L-clodronate at 6 hpA. Fin images are representative confocal maximum projections of Ds-Red (magenta) fluorescence in mesenchymal cells of the fins at 72 hpA. Arrowheads show round mesenchymal cells at the wound of late macrophage-depleted larvae. Scale bar=100 μm |
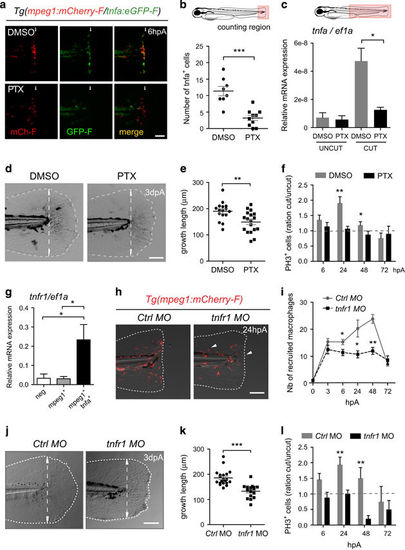
TNF signaling is required for caudal fin regeneration. (a) Tg(mpeg1:mCherry-F/tnfa:eGFP-F) larvae were amputated and treated with either DMSO or pentoxifylline (PTX). Representative fin images show single fluorescence channels and overlay of fluorescence (Merge) at 6 hpA. White arrows indicate the wound. (b) Number of GFP-F+ cells in the wound region in indicated conditions (Nlarvae=8–10, mean±S.E.M., two independent experiments, ***P<0.001). (c) qRT-PCR of tnfa mRNA relative to ef1a in DMSO or PTX treated larvae. Caudal fins were uncut or cut at 3 dpf and larvae were immediately treated with DMSO or PTX. RNA was extracted from tails (18 larvae per sample, mean±S.E.M. of three experiments, *P<0.05). (d) Representative transmitted light images of fins at 3 dpA after DMSO and PTX treatments. (e) Regenerated fin length at 3 dpA in indicated conditions (mean±S.E.M., three independent experiments, **P<0.005). (f) Blastema cell proliferation at 6, 24, 48 and 72 hpA in indicated conditions. Mitotic cells were detected in the fin region using an anti-PH3 antibody (Nlarvae=13–23, average of cut/uncut ratio±S.E.M., two independent experiments, *P<0.05, **P<0.005). (g) Steady state levels of tnfr1 mRNA in sorted macrophages. Tg(mpeg1:mCherry-F /tnfa:eGFP-F) were amputated at 3 dpf and cells were collected at 6 hpA using fluorescence-activated flow cytometry and qRT-PCR used to quantify tnfr1 mRNA steady state levels relative to ef1a in the following cell populations: mpeg1−tnfa− (neg), mpeg1+tnfa− (mpeg1+) and mpeg1+tnfa+ (mean values of four independent experiments±S.E.M. *P<0.05). (h) Fin images are representative overlays of mCherry fluorescence with transmitted light of Tg(mpeg1:mCherry-F) control morphants (Ctrl MO) or tnfr1 morphants (tnfr1 MO) at 24 hpA. (i) Macrophages (mCherry-F+) recruitment in the wound region at indicated time points in Ctrl and tnfr1 morphants (Nlarvae=5–18 per group, mean±S.E.M., two independent experiments, *P<0.05, **P<0.005 respect to Ctrl MO condition). (j) Fin images are representative transmitted light images of Ctrl morphants and tnfr1 morphants at 3 dpA. (k) Corresponding regenerated fin length (mean±S.E.M. from three independent experiments, ***P<0.001). (l) Blastema cell proliferation at 6, 24, 48 and 72 hpA in indicated conditions was detected using an anti-PH3 antibody (Nlarvae=5–17, cut/uncut ratio±S.E.M., two independent experiments, **P<0.01). (a, d, h and j) Dotted lines outline the fin, dashed arrows indicate the position of the initial amputation; scale bar=100μm EXPRESSION / LABELING:
PHENOTYPE:
|
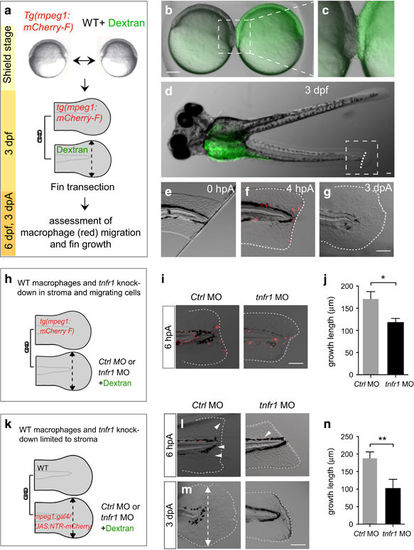
tnfr1 knockdown in stromal cells impairs fin regeneration. (a–g) Macrophages migrate to the wound in parabiotic larvae following caudal fin amputation. (a) Schematic representation of the parabiosis experiment. (b) Generation of conjoined Tg(mpeg1:mCherry-F) and WT (Dextran-fluorescein) embryos at the shield stage, (c) high magnification of the region boxed in b. (d) At 3 dpf, conjoined larvae developed with rostral portion of the body fused. WT larva was identified using the green fluorescence of dextran-fluorescein in the yolk sac and selected for caudal fin amputation (dashed line). (e) The caudal fin from WT larva was amputated at 3 dpf, 0 hpA; no mCherry-F+ macrophages were detected in the fin. (f) After amputation mCherry-F+ macrophages migrate to the wound at 4 hpA and (g) the fin completely regenerate at 3 dpA (Nlarvae=6, scale bars=100 μm). (h) Schematic representation of the parabiosis experiment using Tg(mpeg1:mCherry-F) and tnfr1 (tnfr1 MO) or control (Ctrl MO) morphants. Caudal fin of morphant was amputated at 3 dpf in the region indicated with dashed arrow. (i) Representative fin images of mCherry fluorescence merged with transmitted channel at 6 hpA show tnfr1WT macrophages (mCherry-F+) recruited in the amputated caudal fin of both tnfr1 and ctrl morphants. (j) Corresponding quantification of the regenerated fin length at 3 dpA in indicated conditions (tnfr1 MO, Nlarvae=6 and Ctrl MO, Nlarvae=8. (k) Schematic representation of the parabiosis experiment using WT and Tg(mpeg1:GAL4/UAS:NTR-mCherry) that were previously injected with tnfr1 MO or Ctrl MO. To induce macrophage depletion in one of the partner, parabiotic larvae were treated with MTZ at 48 hpf and the caudal fin of the morphant (fluorescein) was amputated at 3 dpf. (l) Representative fin images of mCherry fluorescence merged with transmitted channel at 6 hpA show NTR-mCherry+ macrophages that are mainly depleted. White arrowheads show residual fluorescence in cells or cell fragments. (m) Fin images are representative transmitted light images at 3 dpA in tnfr1 and Ctrl morphants. (n) Corresponding quantification of the regenerated fin length in indicated conditions (Nlarvae=4–6 mean±S.E.M., *P<0.05). (f, g, i, l and m) Dotted lines outline the fin. (m) Dashed arrows indicate the position of the initial transection. Scale bars=100 μm |
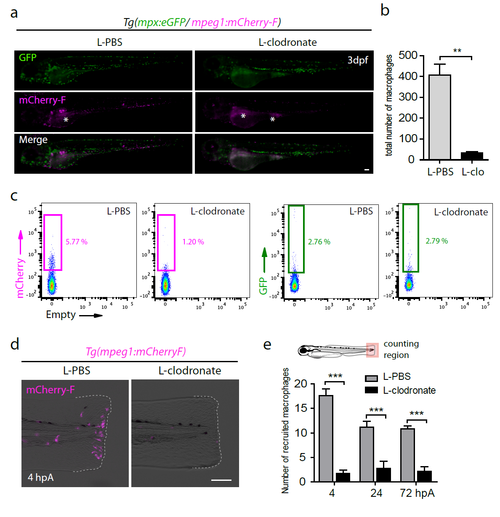
L-clodronate injections in Tg(mpeg1:mCherry-F) larvae efficiently ablate macrophages. (a) Double transgenic larvae Tg(mpx:eGFP/mpeg1:mCherry-F) were injected with either L-PBS or L-clodronate in the caudal vein at 48 hpf. eGFP (Green) and mCherry (Magenta) fluorescence were analyzed by microscopy at 3 dpf. Larva images are representative single fluorescence channels and overlay images (Merge). Asterisks show the auto-fluorescence of the yolk sac and extension. (b) Quantification of total macrophages in Tg(mpeg1:mCherry-F) 24 hours after L-PBS or L-clodronate (L-clo) injections using fluorescence microscopy (mean ± s.e.m, Nlarvae=5, **p<0.01). (c) Graphed data of fluorescence-activated flow cytometry analysis of mpeg1+ and mpx+ cells 24 hours after injection of L-clodronate or L-PBS. Tg(mpeg1:mCherry- F/mpx:eGFP) larvae were either injected with L-PBS or with L-clodronate at 2 dpf and cells from a pool of 40 larvae were collected 24 hours later. Gates represent mCherry-F+ and eGFP+ populations (the percentage among total cells is indicated). (d) Tg(mpeg1:mCherry-F) larvae were injected with L-PBS or L-clodronate at 48 hpf and amputated at 3 dpf. Fin images are representative overlay of mCherry fluorescence (magenta) with transmitted light acquired by microscopy at 4 hpA. Dotted lines outline the fin. (e) Corresponding counts of recruited macrophages in the caudal fin region in indicated conditions (mean number of cells ± s.e.m, Nlarvae=10-12 larvae per groups, ***p<0.001). (a, d) Scale bars = 100 μm. |
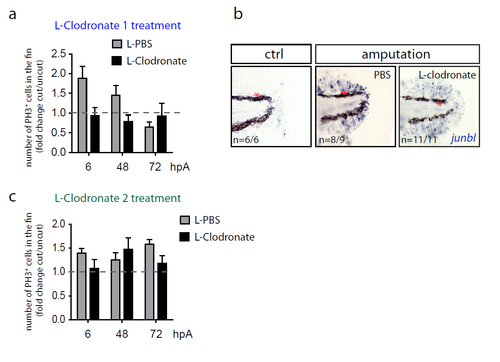
Depletion of macrophages using L-Clodronate injections in early stages but not late stages of regeneration impairs blastema formation. (a and c) Blastema cell proliferation at 6, 48 and 72 hpA after L-clodronate 1 (a) and Lclodronate 2 (c) treatments in indicated conditions. Mitotic cells were detected using an anti-phosphorylated histone H3 (PH3) antibody (Nlarvae = 4-6 per group, average value of cut/uncut ratio ± s.e.m, differences are not significant). (b) junbl mRNA expression (blue), as shown by in situ hybridization, in non-amputated fin or 6 hpA, in Tg(mpeg1:mCherry-F) larvae that were previously injected with PBS or L-clodronate 24 hours before amputation. |
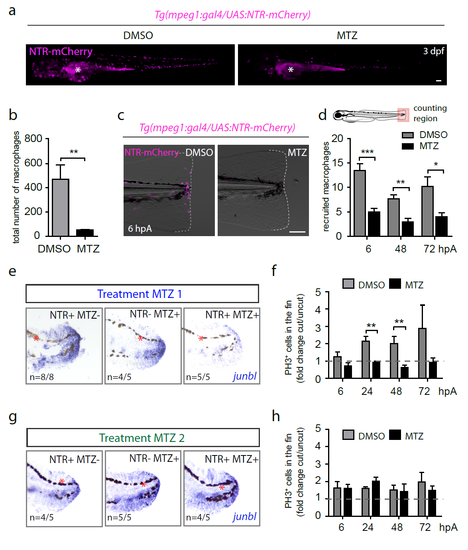
Metronidazol treatments on Tg(mpeg1:GAL4/UAS:NTRmCherry) larvae efficiently ablate macrophages and impair blastema formation in early stages of regeneration. (a) Tg(mpeg1:GAL4/UAS:NTR-mCherry) larvae were treated with either Metronidazol (MTZ) or DMSO at 48 hpf. NTR-mCherry fluorescence (magenta) was analyzed by microscopy 24 hours later (3dpf). Asterisks show the auto-fluorescence of the yolk sac and extension. (b) Corresponding counts of total macrophages in indicated conditions (mean ± s.e.m, Nlarvae=5-6, **p<0.005). (c) Tg(mpeg1:GAL4/UAS:NTR-mCherry) larvae were treated with either MTZ or DMSO at 48 hpf and amputated at 3 dpf. Fin images are representative overlay of NTR-mCherry fluorescence (magenta) with transmitted light acquired by microscopy at 6 hpA. Dotted lines outline the fin. (a, c) Scale bars = 100 μm. (d) Corresponding counts of recruited macrophages in the caudal fin region in indicated conditions (mean number of cells ± s.e.m (Nlarvae=6-12 per group, ***p<0.001, **p<0.005 and *p<0.05). (e and g) junbl mRNA expression (blue) at 24 hpA, as shown by in situ hybridization in (NTR+ MTZ-), (NTR- MTZ+) and (NTR+ MTZ+) larvae. Tg(mpeg1:GAL4/UAS:NTR-mCherry) larvae were treated with MTZ (NTR+ MTZ+). DMSO treatments on the same line (NTR+ MTZ-) or MTZ treatments on WT siblings (NTR- MTZ+) were used as controls. Larvae were treated with DMSO or MTZ either 24 hours before amputation (Treatment MTZ 1, e) or at 6 hpA (Treatment MTZ 2, g), red asterisks show pigments (black). (f and h) Blastema cell proliferation at 6, 24, 48 and 72 hpA after MTZ 1 (f) and MTZ 2 (h) treatments in indicated conditions using an anti-PH3 antibody (Nlarvae = 5-7 per group, mean values ± s.e.m, **p<0.01). |

Effect of tnfa morpholino on caudal fin regeneration (a) Fin images are representative transmitted light images of Ctrl morphants and tnfa morphants at 3dpA. (b) Corresponding regenerated fin length (mean ±s.e.m. from three independent experiments, ***P<0.001). (c) Schematic representation of the parabiosis experiment using tnfa MO or WT (CTRL) and Tg(mpeg1:GAL4/UAS:NTR-mCherry). Parabiotic larvae were treated with MTZ at 48 hpf and the caudal fin of Tg(mpeg1:GAL4/UAS:NTR-mCherry) was amputated at 3 dpf. (d) Representative fin images of mCherry fluorescence merged with transmitted channel at 6 hpA show NTRmCherry+ macrophages that are mainly depleted. White arrowheads show residual fluorescence in cells or cell fragments. (e) Fin images are representative transmitted light images at 3 dpA in tnfa morphants and CTRL. (f) Corresponding quantification of the regenerated fin length in indicated conditions (Nlarvae=8-10 mean ± s.e.m., *P<0.05). In (a, d and e) dotted lines outline the fin, dashed arrows indicate the position of the initial transection. Scale bars = 100 μm. PHENOTYPE:
|