
Fig. 6
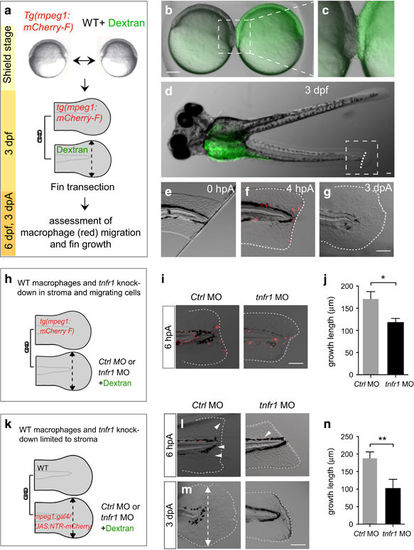
tnfr1 knockdown in stromal cells impairs fin regeneration. (a–g) Macrophages migrate to the wound in parabiotic larvae following caudal fin amputation. (a) Schematic representation of the parabiosis experiment. (b) Generation of conjoined Tg(mpeg1:mCherry-F) and WT (Dextran-fluorescein) embryos at the shield stage, (c) high magnification of the region boxed in b. (d) At 3 dpf, conjoined larvae developed with rostral portion of the body fused. WT larva was identified using the green fluorescence of dextran-fluorescein in the yolk sac and selected for caudal fin amputation (dashed line). (e) The caudal fin from WT larva was amputated at 3 dpf, 0 hpA; no mCherry-F+ macrophages were detected in the fin. (f) After amputation mCherry-F+ macrophages migrate to the wound at 4 hpA and (g) the fin completely regenerate at 3 dpA (Nlarvae=6, scale bars=100 μm). (h) Schematic representation of the parabiosis experiment using Tg(mpeg1:mCherry-F) and tnfr1 (tnfr1 MO) or control (Ctrl MO) morphants. Caudal fin of morphant was amputated at 3 dpf in the region indicated with dashed arrow. (i) Representative fin images of mCherry fluorescence merged with transmitted channel at 6 hpA show tnfr1WT macrophages (mCherry-F+) recruited in the amputated caudal fin of both tnfr1 and ctrl morphants. (j) Corresponding quantification of the regenerated fin length at 3 dpA in indicated conditions (tnfr1 MO, Nlarvae=6 and Ctrl MO, Nlarvae=8. (k) Schematic representation of the parabiosis experiment using WT and Tg(mpeg1:GAL4/UAS:NTR-mCherry) that were previously injected with tnfr1 MO or Ctrl MO. To induce macrophage depletion in one of the partner, parabiotic larvae were treated with MTZ at 48 hpf and the caudal fin of the morphant (fluorescein) was amputated at 3 dpf. (l) Representative fin images of mCherry fluorescence merged with transmitted channel at 6 hpA show NTR-mCherry+ macrophages that are mainly depleted. White arrowheads show residual fluorescence in cells or cell fragments. (m) Fin images are representative transmitted light images at 3 dpA in tnfr1 and Ctrl morphants. (n) Corresponding quantification of the regenerated fin length in indicated conditions (Nlarvae=4–6 mean±S.E.M., *P<0.05). (f, g, i, l and m) Dotted lines outline the fin. (m) Dashed arrows indicate the position of the initial transection. Scale bars=100 μm |