
|
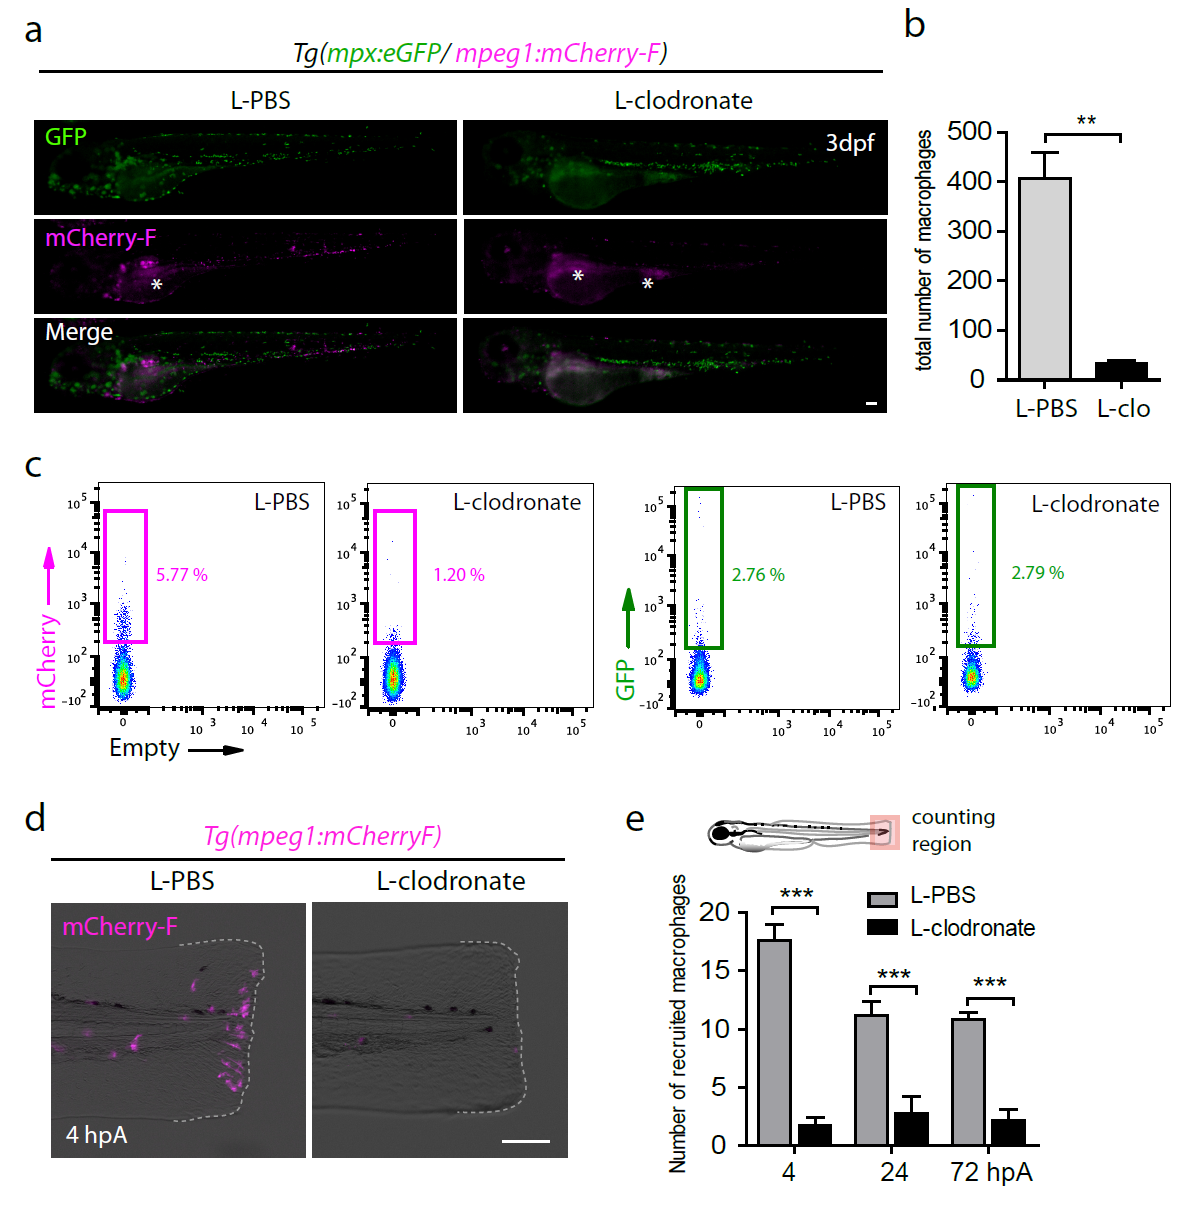
Fig. S1
L-clodronate injections in Tg(mpeg1:mCherry-F) larvae efficiently ablate macrophages. (a) Double transgenic larvae Tg(mpx:eGFP/mpeg1:mCherry-F) were injected with either L-PBS or L-clodronate in the caudal vein at 48 hpf. eGFP (Green) and mCherry (Magenta) fluorescence were analyzed by microscopy at 3 dpf. Larva images are representative single fluorescence channels and overlay images (Merge). Asterisks show the auto-fluorescence of the yolk sac and extension. (b) Quantification of total macrophages in Tg(mpeg1:mCherry-F) 24 hours after L-PBS or L-clodronate (L-clo) injections using fluorescence microscopy (mean ± s.e.m, Nlarvae=5, **p<0.01). (c) Graphed data of fluorescence-activated flow cytometry analysis of mpeg1+ and mpx+ cells 24 hours after injection of L-clodronate or L-PBS. Tg(mpeg1:mCherry- F/mpx:eGFP) larvae were either injected with L-PBS or with L-clodronate at 2 dpf and cells from a pool of 40 larvae were collected 24 hours later. Gates represent mCherry-F+ and eGFP+ populations (the percentage among total cells is indicated). (d) Tg(mpeg1:mCherry-F) larvae were injected with L-PBS or L-clodronate at 48 hpf and amputated at 3 dpf. Fin images are representative overlay of mCherry fluorescence (magenta) with transmitted light acquired by microscopy at 4 hpA. Dotted lines outline the fin. (e) Corresponding counts of recruited macrophages in the caudal fin region in indicated conditions (mean number of cells ± s.e.m, Nlarvae=10-12 larvae per groups, ***p<0.001). (a, d) Scale bars = 100 μm.