
- Title
-
Deficiency of smarcal1 causes cell cycle arrest and developmental abnormalities in zebrafish
- Authors
- Huang, C., Gu, S., Yu, P., Yu, F., Feng, C., Gao, N., and Du, J.
- Source
- Full text @ Dev. Biol.
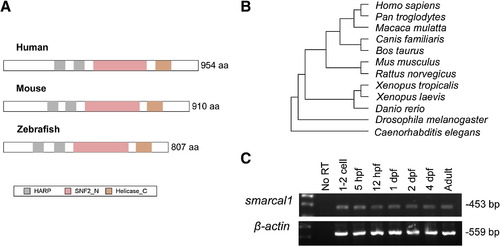
Structure and expression of smarcal1. (A) Structural comparison of putative zebrafish Smarcal1 with human and mouse SMARCAL1 protein. HARP: HepA-related protein; SNF2_N: SNF2 family N-terminal domain; Helicase_C: Helicase superfamily c-terminal domain. (B) Phylogenetic analysis shows that zebrafish Smarcal1 protein is conserved among vertebrates. (C) RT-PCR detection of maternal and zygotic smarcal1 transcript from 1-cell stage to adult zebrafish. |

Design and efficiency of smarcal1 MOs. (A) Design of smarcal1 MOs and RT-PCR primers for detecting the splice-blocked smarcal1 mRNA. P1 and P2 indicate the primers used in (D). (B) Embryos with injection of smarcal1 5′ UTR-5′cds-GFP mRNA (50 pg per embryo) displayed green fluorescence, whereas co-injection of smarcal1 MO1 (8 ng per embryo) with 5′ UTR-5′cds-GFP mRNA (50 pg per embryo) blocked fluorescence signal. (C) Knockdown efficiency of smarca11 MO1 analyzed by Western blot with V5 antibody. V5-tagged full-length zebrafish smarcal1 injected embryos (200 pg per embryo) showed the induction of 85 KD protein, whereas co-injection with 8 ng of MO1 inhibited the protein translation. A 105 KD non-specific band and β-actin serve as loading control. (D) RT-PCR analysis of splice-blocking efficiency of MO2. A 640 bp product was amplified from WT embryos and MO2 deleted about 70 nucleotides of smarcal1 mRNA. In each group, 20 embryos were pooled for western blot and RT-PCR experiments. |

Knockdown of smarcal1 causes developmental defects in zebrafish. (A–F) The gross morphology of 1 dpf and 2 dpf smarcal1 morphants. The morphology of uninjected and control MO injected embryos (8 ng per embryo) was largely normal. By 2 dpf, the embryos injected with smarcal1 MO (8 ng per embryo) showed growth defects including less dark pigment, unconsumed yolk sac and heart edema (F). (G–I) O-dianisidine staining of 2 dpf embryos showed reduced hemoglobin-positive cells on the yolk in smarcal1 morphants (I). Anterior is to the left. PHENOTYPE:
|

Knockdown of smarcal1 reduces expression of hematopoietic genes. (A-H) WISH shows that expression of hemangioblast marker scl and hematopoietic stem cell marker gata2 were not affected by knockdown of smarcal1, whereas erythroid progenitor marker gata1 and erythroid marker β-E1 globin were significantly reduced. All embryos are in lateral view with anterior to the left. (I) Real-time RT-PCR results from 24 hpf embryos show that smarcal1 MO significantly reduced the expression of gata1 and β-E1 globin. (J-O) The expressions of myeloid progenitor marker pu.1, macrophage marker l-plastin and heterophil granulocyte marker mpo were not obviously changed by knockdown of smarcal1 at 18 hpf. (P) Real-time RT-PCR shows reduced expression of definitive erythroid marker runx1 in 24 hpf MO1 injected embryos. (Q-V) Knockdown of smarcal1 suppressed definitive hematopoiesis.. (Q-S) show the expression of pu.1, l-plastin and mpo at definitive myeloid cells and (T-V) show the markers were down-regulated by knockdown of smarcal1 at 30 hpf. The real time PCR results were obtained from at least three experiments. β-actin mRNA was measured as an internal control. Data are presented as means ± SE. low asteriskP < 0.05. EXPRESSION / LABELING:
|
Knockdown of smarcal1 reduces expression of hematopoietic genes. (A–H) WISH shows that expression of hemangioblast marker scl and hematopoietic stem cell marker gata2 were not affected by knockdown of smarcal1, whereas erythroid progenitor marker gata1 and erythroid marker β-E1 globin were significantly reduced. All embryos are in lateral view with anterior to the left. (I) Real-time RT-PCR results from 24 hpf embryos show that smarcal1 MO significantly reduced the expression of gata1 and β-E1 globin. (J–O) The expressions of myeloid progenitor marker pu.1, macrophage marker l-plastin and heterophil granulocyte marker mpo were not obviously changed by knockdown of smarcal1 at 18 hpf. (P) Real-time RT-PCR shows reduced expression of definitive erythroid marker runx1 in 24 hpf MO1 injected embryos. (Q–V) Knockdown of smarcal1 suppressed definitive hematopoiesis.. (Q–S) show the expression of pu.1, l-plastin and mpo at definitive myeloid cells and (T–V) show the markers were down-regulated by knockdown of smarcal1 at 30 hpf. The real time PCR results were obtained from at least three experiments. β-actin mRNA was measured as an internal control. Data are presented as means ± SE. ∗P < 0.05. PHENOTYPE:
|
|
Fig. 6. Knockdown of smarcal1 changes the expressions of cell cycle-related genes. Real-time PCR experiments show that mRNA levels of cyclinA (A) was suppressed and p21 (B) was increased by smarcal1 MO at 1 dpf and 2 dpf. The levels of cyclinB1, cyclinD1, cyclinE were not changed at 1 dpf, whereas the expressions of cyclinD1 increased at 2 dpf (A). The expression levels of cdkn1b (p27) and cdkn1c (p57) remained no significant change (B). The results were obtained from at least three experiments. β-actin mRNA was measured as an internal control. Data are presented as means ± SE. low asteriskP < 0.05; low asterisklow asteriskP < 0.01. |
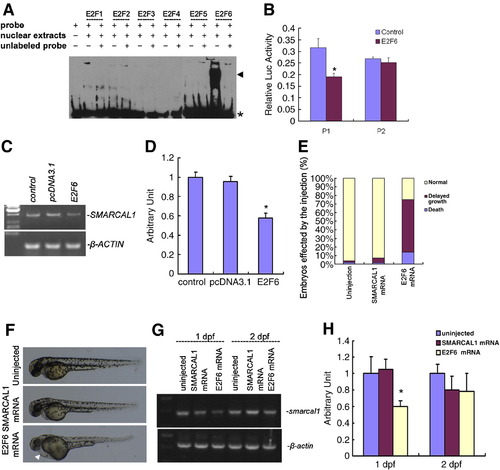
smarcal1 is a direct target of E2F6. (A) Demonstration of E2Fs binding to SMARCAL1 promoter by EMSA. EMSA using nuclear protein extracts from E2Fs-dp1 co-transfected 293T cells shows that E2F-dp1 complexes bound to E2F sites in SMARCAL1 promoter. 200 times unlabeled probe was used to compete with the biotin labeled probe. The black arrowhead indicates the band of specific DNA–protein complexes. The asterisk indicates the band of the unbound probe. (B) Reporter gene assay shows SMARCAL1 transactivity was specifically inhibited by E2F6. E2F6-dp1 co-transfected with SMARCAL1 reporter plasmids and renilla luciferase activity was measured as transfection control. P1: pGL3-SMARCAL1 promoter1 containing E2F binding sites. P2: pGL3-SMARCAL1 promoter2 without E2F binding sites.∗P < 0.05. (C) RT-PCR analysis of SMARCAL1 expression in E2F6 transfected 293T cells. The empty vector of pcDNA3.1 was transfected as a control. PCR was performed for 26 cycles. (D) Real time PCR analysis of mRNA levels in 293T cells in (C). The results represent three experiments. β-actin mRNA was measured as an internal control. Data are presented as means ± SE. ∗P < 0.05. (E) Embryos injected with E2F6 mRNA (200 pg per embryo) showed gross morphology defects similar to smarcal1 morphants at 2 dpf. Human SMARCAL1 mRNA (200 pg per embryo) was used as control. (F) Example of E2F6 mRNA injected embryos. White arrowhead in the bottom image indicates the heart edema. (G) E2F6 mRNA injection inhibits smarcal1 mRNA expression in zebrafish embryos at 24 hpf but not at 48 hpf. Human SMARCAL1 mRNA (200 pg per embryo) was used as control. (H) Real time PCR analysis of mRNA levels in embryos in (G). The results represent three experiments. β-actin mRNA was measured as an internal control. Data are presented as means ± SE. ∗P < 0.05. |
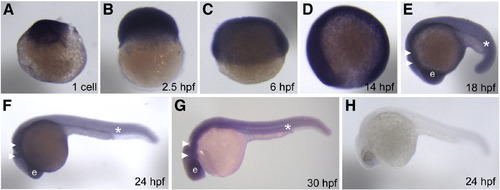
Expression pattern of smarcal1 during early embryonic development. (A-J) Whole-mount in situ hybridization shows smarcal1 expression in embryos at 1-cell (A), 2.5 hpf (B), 6 hpf (C), 14 hpf (D), 18 hpf (E), 24 hpf (F), 30 hpf (G) and the staining of smarcal1 sense probe in 24 hpf embryo (H). Embryos in panels (A-C) are lateral views with animal pole on top. Embryos in panels (D-H) are lateral views with anterior to the left. e: eye. White arrowhead: CNS. White asterisk: ICM. |
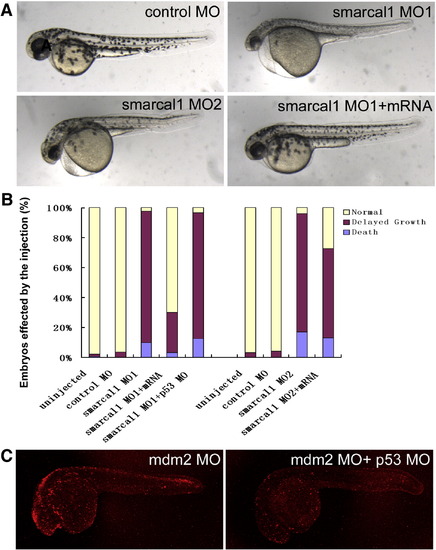
Phenotypes of 2 dpf embryos. (A) Examples of 2 dpf embryo injected with control MO, smarcal1 MO1, smarcal1 MO2, and smarcal1 MO1+ smarcal1 mRNA. (B) Embryos affected by MO injection (%) of 2 dpf embryos. (C) p53 MO inhibits mdm2 induced apoptosis in 2dpf embryo. PHENOTYPE:
|
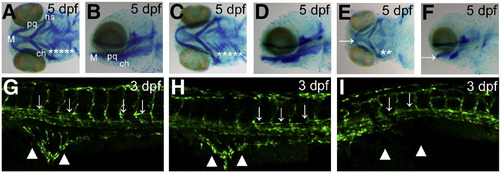
Knockdown of smarcal1 causes the defects in cartilage development and angiogenesis. (A-F) Arch cartilage stained with Alcian blue. While the uninjected and control MO injected embryos had clearly visible certobranical arches, smarcal1 morphants showed absence of cb 3 through 5 and under development of M, pq, ch and hs. M: Meckel′s cartilage; pq: palatoquadrate; ch: ceratohyal; hs: hyosmplectic; cb: ceratobranchials. Asterisks in (A), (C) and (E) indicate the cb. Arrows in (E) and (F) indicate M. (G–I) Angiogenesis defects in 3 dpf smarcal1 morphants. Confocal microangiograpy of uninjected (G) and control MO injected embryo (H) of Tg (fli1:GFP) had no defect in PAV (arrows) and SIV (arrowheads), whereas the smarcal1 morphant (I) showed the absence of PAV and severe reduction in branching of SIV. PAV: parachordal vessel; SIV: subintestinal vessel. PHENOTYPE:
|
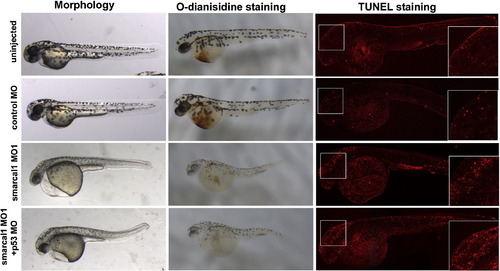
p53 MO does not rescue the phenotypes of smarcal1 morphants. Compared with smarcal1 morphants, p53 MO and smarcal1 MO co-injected embryos show similar developmental defects in gross morphology, erythrogenesis and apoptosis. Blood cells were stained with O-dianisidine and apoptosis was assayed with TUNEL at 2 dpf embryos. The higher magnification images of TUNEL staining were shown in the right panel. |
|
Unillustrated author statements PHENOTYPE:
|
Reprinted from Developmental Biology, 339(1), Huang, C., Gu, S., Yu, P., Yu, F., Feng, C., Gao, N., and Du, J., Deficiency of smarcal1 causes cell cycle arrest and developmental abnormalities in zebrafish, 89-100, Copyright (2010) with permission from Elsevier. Full text @ Dev. Biol.