
- Title
-
Opposite effects of Activin type 2 receptor ligands on cardiomyocyte proliferation during development and repair
- Authors
- Dogra, D., Ahuja, S., Kim, H.T., Rasouli, S.J., Stainier, D.Y.R., Reischauer, S.
- Source
- Full text @ Nat. Commun.
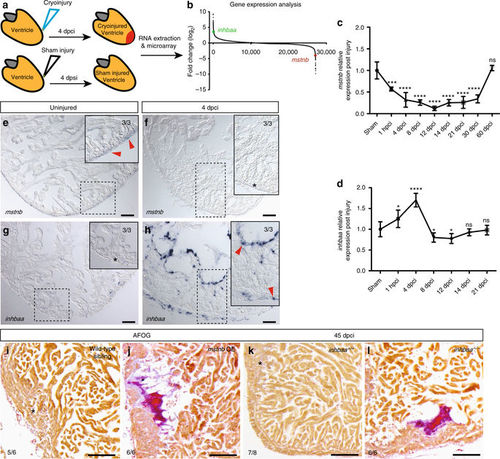
mstnb and inhbaa have opposing response and functions during zebrafish cardiac regeneration. a Schematic representation of injury and sample preparation for microarray analysis (n?=?12 hearts). b Averaged transcriptional gene expression changes post cryoinjury as assessed by microarray analysis (inhbaa and mstnb indicated). c, d Temporal RT-qPCR analysis for mstnb and inhbaa expression post cryoinjury (n?=?2?�?3 cardiac ventricles assessed as two biological and two technical replicates for each time point, data are mean?�?s.e.m., ns: no significant changes observed, *P???0.05, ***P???0.001, and ****P???0.0001?Student?s t test, two-tailed). e?h In situ hybridization for mstnb and inhbaa expression on uninjured and 4 dpci adult zebrafish heart sections. Higher magnifications of dashed boxes in e?h are shown in upper right corners. RNA probe signal is indicated by red arrowheads and the absence of signal is indicated by asterisks. The numerators indicate the number of hearts with a particular pattern of signal, and the denominators the total number of hearts analyzed. i?l AFOG staining of sections from wild-type sibling, mstnb OE, inhbaa +/+, and inhbaa ?/? cryoinjured hearts at 45 dpci. Healthy myocardium in orange, fibrin in red, collagen in blue. Asterisks indicate the regions of resolved scarring. The numerators indicate the number of hearts with a particular pattern of scarring, and the denominators the total number of hearts analyzed. Scale bars: in situ hybridization images, 50?�m; AFOG staining images, 100?�m |

mstnb GOF and inhbaa LOF suppress CM proliferation during cardiac regeneration. a, b Sections of wild-type sibling and mstnb OE cryoinjured hearts in Tg(myl7:nlsDsRedExpress) background at 6 dpci; ?-DsRed (red), PCNA (green). Yellow dotted regions delineate the injured area. Higher magnifications of dashed boxes in a, b are shown on right side. White arrowheads point to proliferating CMs (PCNA+/DsRed+). c Quantification of CM proliferation in wild-type sibling (n?=?6) and mstnb OE (n?=?6) cryoinjured hearts in the 100?�m region adjacent to the injured area at 6 dpci. d, e Sections of inhbaa +/+ and inhbaa ?/? cryoinjured hearts in Tg(myl7:nlsDsRedExpress) background at 6 dpci; ?-DsRed (red), PCNA (green). Higher magnifications of dashed boxes in d, e are shown on right side. f Quantification of CM proliferation in inhbaa +/+ (n?=?6) and inhbaa ?/? (n?=?6) cryoinjured hearts in the 100?�m region adjacent to the injured area at 6 dpci. All cell counts were performed on three sections from each heart. Each data point on dot plot represents one heart (data are mean?�?s.e.m., **P???0.01?Student?s t test, two-tailed). Scale bars: heart sections, 100?�m; higher magnifications, 50?�m |

mstnb LOF and inhbaa GOF positively affect physiological CM proliferation and cardiac regeneration. a Experimental setup of EdU treatment, followed by heart extraction and fixation. b, c Sections of mstnb +/+ and mstnb ?/? adult hearts in Tg(myl7:nlsDsRedExpress) background; ?-DsRed (red), MF-20 (blue), EdU (green). Higher magnifications of dashed boxes in b, c are shown in upper right corners. White arrowheads point to EdU+/DsRed+ CMs. d, e Quantification of total CMs (DsRed+) and EdU incorporating CMs (EdU+/DsRed+) in the compact and trabecular layers of mstnb +/+ (n?=?5) and mstnb ?/? (n?=?5) ventricles. f, g Sections of wild-type sibling and inhbaa OE adult hearts in Tg(myl7:nlsDsRedExpress) background; ?-DsRed (red), EdU (green). Higher magnifications of dashed boxes in f, g are shown in upper left and upper right corners. h, i Quantification of total CMs (DsRed+) and EdU incorporating CMs (EdU+/DsRed+) in wild-type sibling (n?=?5) and inhbaa OE (n?=?5) hearts. All cell counts were performed on three sections from each heart. Each data point on dot plot represents one heart (data are mean?�?s.e.m., *P???0.05, **P???0.01, ***P???0.001?Student?s t test, two-tailed). j?m AFOG staining of sections from mstnb +/+ (n?=?3), mstnb ?/? (n?=?4), wild-type sibling (n?=?4), and inhbaa OE (n?=?4) cryoinjured hearts at 30 dpci. Asterisks indicate the regions of resolved scarring. The numerators indicate the number of hearts with a particular pattern of scarring, and the denominators the total number of hearts analyzed. Scale bars, 100?�m. dpt, days post treatment; vent., ventricle; atr., atrium PHENOTYPE:
|
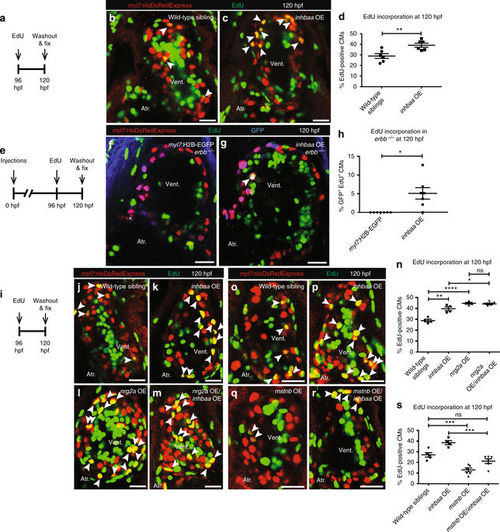
inhbaa GOF promotes CM proliferation independently of ErbB2 signaling and competes with mstnb GOF. a Experimental setup of EdU treatment, followed by fixation. b, c Tg(myl7:nlsDsRedExpress) hearts of wild-type sibling and inhbaa OE larvae at 120 hpf; ?-DsRed (red), EdU (green). White arrowheads point to proliferating CMs (EdU+/DsRed+). d Quantification of CM proliferation in wild-type sibling (n?=?6) and inhbaa OE (n?=?6) ventricles at 120 hpf. e Experimental setup of injections, EdU exposure, followed by fixation. f, g Tg(myl7:nlsDsRedExpress) hearts of myl7:H2B-EGFP and myl7:inhbaa-2A-H2B-EGFP(inhbaa OE) injected erbb ?/? larvae at 120 hpf; ?-DsRed (red), ?-GFP (blue), EdU (green). White arrowheads point to proliferating CMs (EdU+/DsRed+/GFP+). h Quantification of CM proliferation in myl7:H2B-EGFP (n?=?7) and inhbaa OE (n?=?7) injected ventricles at 120 hpf. i Experimental setup of EdU treatment, followed by fixation. j?m Tg(myl7:nlsDsRedExpress) hearts of wild-type sibling, inhbaa OE, nrg2a OE, and nrg2a OE/inhbaa OE larvae at 120 hpf; ?-DsRed (red), EdU (green). White arrowheads point to proliferating CMs (EdU+/DsRed+). n Quantification of CM proliferation in wild-type sibling (n?=?4), inhbaa OE (n?=?4), nrg2a OE (n?=?4), and nrg2a OE/inhbaa OE (n?=?5) ventricles at 120 hpf. o?r Tg(myl7:nlsDsRedExpress) hearts of wild-type sibling, inhbaa OE, mstnb OE, and mstnb OE/inhbaa OE larvae at 120 hpf; ?-DsRed (red), EdU (green). s Quantification of CM proliferation in wild-type sibling (n?=?5), inhbaa OE (n?=?4), mstnb OE (n?=?6), and mstnb OE/inhbaa OE (n?=?6) ventricles at 120 hpf. All cell counts were performed on non-overlapping confocal planes (thickness, 1?�m) (data are mean?�?s.e.m., ns: no significant changes observed, *P???0.05, **P???0.01, ***P???0.001 and ****P???0.0001?Student?s t test, two-tailed). Scale bars, 20?�m. vent., ventricle; atr., atrium |
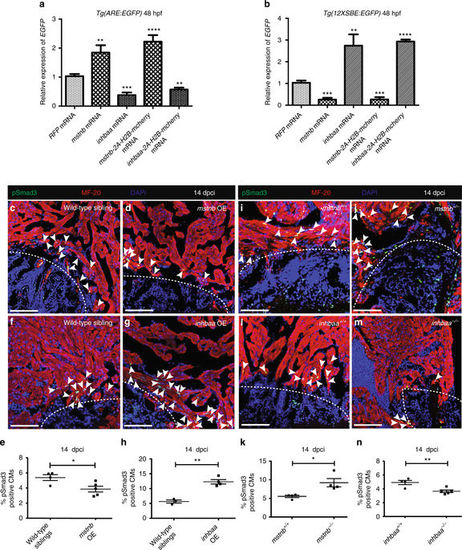
mstnb and inhbaa inversely regulate the activities of Smad2 and Smad3 response elements, as well as Smad3 phosphorylation. a RT-qPCR analysis for relative EGFP mRNA expression in 48 hpf Tg(ARE:EGFP) embryos injected with mstnb, inhbaa, mstnb-2A-H2B-mcherry, and inhbaa-2A-H2B-mcherry mRNA compared to RFP mRNA injected (n?=?2?�?10 embryos assessed as 2 biological and 2 technical replicates). b RT-qPCR analysis for relative EGFP mRNA expression in 48 hpf Tg(12XSBE:EGFP) embryos injected with mstnb, inhbaa, mstnb-2A-H2B-mcherry, and inhbaa-2A-H2B-mcherry mRNA compared to RFP mRNA injected (n?=?2?�?10 embryos assessed as two biological and two technical replicates). c, d Sections of wild-type sibling and mstnb OE cryoinjured hearts at 14 dpci; pSmad3 (green), ?-MF-20 (red), DAPI (blue). White dotted regions delineate the injured area. White arrowheads point to pSmad3+ CMs near the injured area. e Quantification of pSmad3+ CMs in wild-type sibling (n?=?4) and mstnb OE (n?=?5) cryoinjured hearts in the 100?�m region adjacent to the injured area at 14 dpci. f, g Sections of wild-type sibling and inhbaa OE cryoinjured hearts at 14 dpci; pSmad3 (green), ?-MF-20 (red), DAPI (blue). h Quantification of pSmad3+ CMs in wild-type sibling (n?=?3) and inhbaa OE (n?=?4) cryoinjured hearts in the 100?�m region adjacent to the injured area at 14 dpci. i, j Sections of mstnb +/+ and mstnb ?/? cryoinjured hearts at 14 dpci; pSmad3 (green), ?-MF-20 (red), DAPI (blue). k Quantification of pSmad3+ CMs in mstnb +/+ (n?=?4) and mstnb ?/? (n?=?4) cryoinjured hearts in the 100?�m region adjacent to the injured area at 14 dpci. l, m Sections of inhbaa +/+ and inhbaa ?/? cryoinjured hearts at 14 dpci; pSmad3 (green), ?-MF-20 (red), DAPI (blue). n Quantification of pSmad3+ CMs in inhbaa +/+ (n?=?4) and inhbaa ?/? (n?=?5) cryoinjured hearts in the 100?�m region adjacent to the injured area at 14 dpci. All cell counts were performed on three sections from each heart. Each data point on dot plot represents one heart (data are mean?�?s.e.m., *P???0.05, **P???0.01, ***P???0.001 and ****P???0.0001?Student?s t test, two-tailed). Scale bars, 100?�m |
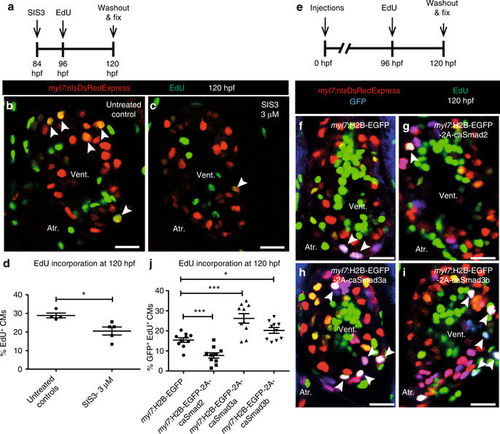
CM proliferation is inversely regulated by Smad2 and Smad3. a Experimental setup of SIS3 treatment, followed by EdU treatment and fixation. b, c Tg(myl7:nlsDsRedExpress) hearts of untreated control and 3?�M SIS3-treated larvae at 120 hpf; ?-DsRed (red), EdU (green). White arrowheads point to proliferating CMs (EdU+/DsRed+). d Quantification of CM proliferation in untreated control (n?=?4) and 3?�M SIS3-treated (n?=?5) ventricles at 120 hpf. e Experimental setup of injections, followed by EdU treatment and fixation. f?i Tg(myl7:nlsDsRedExpress) hearts of myl7:H2B-EGFP, myl7:H2B-EGFP-2A-caSmad2, myl7:H2B-EGFP-2A-caSmad3a and myl7:H2B-EGFP-2A-caSmad3b injected larvae at 120 hpf; ?-DsRed (red), ?-GFP (blue), EdU (green). White arrowheads point to proliferating CMs (EdU+/DsRed+/GFP +). j Quantification of CM proliferation in myl7:H2B-EGFP (n?=?10), caSmad2 (n?=?10), caSmad3a (n?=?10), and caSmad3b (n?=?10) injected ventricles at 120 hpf. All cell counts were performed on non-overlapping confocal planes (thickness, 1?�m) (data are mean?�?s.e.m., *P???0.05 and ***P???0.001?Student?s t test, two-tailed). Scale bars, 20?�m. vent., ventricle; atr., atrium PHENOTYPE:
|

Mstnb and Inhbaa work through distinct Activin type 2 receptors to regulate CM proliferation. a?d RT-qPCR analysis for relative EGFP mRNA expression in 48 hpf Tg(ARE:EGFP) and Tg(12XSBE:EGFP) embryos injected with acvr2aa MO/mstnb-2A-H2B-mcherry mRNA, acvr2ab MO/mstnb-2A-H2B-mcherry mRNA, acvr2ba MO/mstnb-2A-H2B-mcherry mRNA, and acvr2bb MO/mstnb-2A-H2B-mcherry mRNA compared to control MO injected (n?=?2?�?10 embryos assessed as two biological and two technical replicates). e?h RT-qPCR analysis for relative EGFP mRNA expression in 48 hpf Tg(ARE:EGFP) and Tg(12XSBE:EGFP) embryos injected with acvr2ba MO/inhbaa-2A-H2B-mcherry mRNA, acvr2bb MO/inhbaa-2A-H2B-mcherry mRNA, acvr2aa MO/inhbaa-2A-H2B-mcherry mRNA, and acvr2ab MO/inhbaa-2A-H2B-mcherry mRNA compared to control MO-injected (n?=?2?�?10 embryos assessed as two biological and two technical replicates). i Experimental setup of injections, followed by EdU treatment and fixation. j?l Tg(myl7:nlsDsRedExpress) hearts of wild-type sibling, control MO-injected mstnb OE and acvr2bb MO-injected mstnb OE larvae at 72 hpf; ?-DsRed (red), EdU (green). White arrowheads point to proliferating CMs (EdU+/DsRed+). m Quantification of CM proliferation in wild-type sibling (n?=?7), control MO-injected mstnb OE (n?=?8) and acvr2bb MO-injected mstnb OE (n?=?8) ventricles at 72 hpf. n?p Tg(myl7:nlsDsRedExpress) hearts of wild-type sibling, control MO-injected inhbaa OE, and acvr2aa MO-injected inhbaa OE larvae at 72 hpf; ?-DsRed (red), EdU (green). q Quantification of CM proliferation in wild-type sibling (n?=?7), control MO-injected inhbaa OE (n?=?7) and acvr2aa MO-injected inhbaa OE (n?=?8) ventricles at 72 hpf. r Model of ligand-receptor relationship: Mstnb binds to Acvr2b, leading to the activation of Acvr1b/Tgfbr1, which promotes Smad2 and suppresses Smad3 activation. Inversely, Inhbaa binds to Acvr2a, recruiting Acvr1b/Acvr1c, thereby inducing Smad3 and suppressing Smad2 activation. This process is followed by the differential regulation of CM proliferation by Smad2 and Smad3. All cell counts were performed on non-overlapping confocal planes (thickness, 1?�m) (data are mean?�?s.e.m., ns: no significant changes observed, *P???0.05, **P???0.01, ***P???0.001 and ****P???0.0001?Student?s t test, two-tailed). Scale bars, 20?�m. vent., ventricle; atr., atrium PHENOTYPE:
|
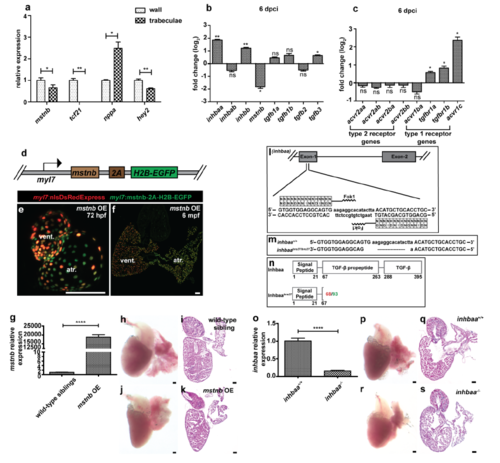
Expression analysis for TGF-? family genes and generation of mstnb GOF and inhbaa LOF lines. (a) RT?qPCR for mstnb, tcf21 (wall-specific), nppa (trabecular-specific) and hey2 (wall-specific) expression in Laser micro dissected wall and trabecular tissues from adult zebrafish heart sections (n=3 hearts assessed in 2 technical replicates). (b) RT?qPCR for TGF-? family ligand gene expression at 6 dpci compared to sham injured hearts (n=2 x 3 cardiac ventricles assessed as 2 biological and 2 technical replicates). (c) RT?qPCR for TGF-? family receptor gene expression at 6 dpci compared to sham injured hearts (n=2 x 3 cardiac ventricles assessed as 2 biological and 2 technical replicates). (d) Schematic representation of CM-specific mstnb OE transgene, Tg(myl7:mstnb-2A-H2B-EGFP). (e) Heart of 72 hpf mstnb OE larva in Tg(myl7:nlsDsRedExpress) background (native fluorescence). (f) Section of mstnb OE adult heart in Tg(myl7:nlsDsRedExpress) background; ?-DsRed (red), ?-GFP (green). (g) RT?qPCR for mstnb expression analysis in wild-type sibling and mstnb OE adult hearts (n=2 x 3 cardiac ventricles assessed as 2 biological and 2 technical replicates). (h- k) mstnb OE adult hearts and Hematoxylin and Eosin (H&E) staining of heart sections show no apparent abnormalities. (l-n) inhbaa TALEN designed to target TGF-? propeptide domain encoded by exon 1 was generated (l), a 17 bp frameshift deletion (inhbaabns37) was identified (m) and is predicted to cause the formation of truncated Inhbaa (n). Red number indicates the last native amino acid before the frameshift mutation; green number indicates the last amino acid before stop codon. (o) RT?qPCR for inhbaa expression analysis in inhbaa+/+ and inhbaa-/- adult hearts (n=2 x 3 cardiac ventricles assessed as 2 biological and 2 technical replicates). (p-s) inhbaa-/- adult hearts and H&E staining of heart sections show no apparent abnormalities. (data are mean � s.e.m., ns: no significant changes observed, *P ? 0.05, **P ? 0.01 and ****P ? 0.0001 - Student?s t-test, two-tailed). Scale bars, 100 ?m. vent., ventricle; atr., atrium; dpf, days post fertilization; mpf, months post fertilization. |

mstnb GOF and inhbaa LOF do not affect CM dedifferentiation during cardiac regeneration. (a-d) Sections of wild-type sibling (n=3), mstnb OE (n=3), inhbaa+/+ (n=3) and inhbaa-/- (n=3) cryoinjured hearts in Tg(myl7:nlsDsRedExpress) background at 6 dpci; ?-DsRed (red), ?-N2.261 (green). Scale bars, 100 ?m. |

Generation and validation of mstnb LOF line. (a-c) mstnb TALEN designed to target the region after the signal peptide encoded by exon 1 was generated (a), a 10 bp frameshift deletion (mstnbbns5) was identified (b) and is predicted to cause the formation of truncated Mstnb (c). Red number indicates the last native amino acid before the frameshift mutation; green number indicates the last amino acid before stop codon. (d) RT?qPCR for mstnb expression analysis in mstnb+/+ and mstnb-/- adult hearts (n=2 x 3 cardiac ventricles assessed as 2 biological and 2 technical replicates). (e-h) mstnb+/+ and mstnb-/- adult hearts, H&E staining of heart sections and higher magnifications of H&E staining showing representative enlarged heart with thickened ventricular wall in mstnb-/- animals. (i-k) Quantification of ventricle, atrium and eye size in mstnb+/+ (n=4) and mstnb-/- (n=5) adults. (l) Quantification of ventricular wall thickness in mstnb+/+ (n=10) and mstnb-/- (n=8) adult hearts. (data are mean � s.e.m., ns: no significant changes observed, *P ? 0.05, **P ? 0.01, ***P ? 0.001 and ****P ? 0.0001 - Student?s t-test, two-tailed). Scale bars, 100 ?m. PHENOTYPE:
|

Generation and validation of inhbaa GOF line. (a) Schematic representation of CM-specific inhbaa OE transgene, Tg(myl7:inhbaa-2A-H2B-EGFP). (b) Heart of 72 hpf inhbaa OE larva in Tg(myl7:nlsDsRedExpress) background (native fluorescence). (c) Section of inhbaa OE adult fish heart in Tg(myl7:nlsDsRedExpress) background; ?-DsRed (red), ?-GFP (green). (d) RT?qPCR for inhbaa expression analysis in wild-type sibling and inhbaa OE adult hearts (n=2 x 3 cardiac ventricles assessed as 2 biological and 2 technical replicates). (e-h) Wild-type sibling and inhbaa OE adult hearts, H&E staining of heart sections and higher magnifications of H&E staining showing representative enlarged heart with dense trabeculae in inhbaa OE animals. (i-k) Quantification of ventricle, atrium and eye size in wild-type sibling (n=5) and inhbaa OE (n=4) adults. (data are mean � s.e.m., ns: no significant changes observed, *P ? 0.05 and **P ? 0.0 by Student?s t-test, two-tailed). Scale bars, 100 ?m. vent., ventricle; atr., atrium. PHENOTYPE:
|

inhbaa GOF promotes CM proliferation during ErbB2 signaling inhibition. (a) Experimental setup of PD168393 treatment, EdU exposure, followed by fixation. (b, c) Tg(myl7:nlsDsRedExpress) hearts of PD168393-treated wild-type sibling and inhbaa OE larvae at 120 hpf; ?-DsRed (red), EdU (green). White arrowheads point to proliferating CMs (EdU+/DsRed+). (d) Quantification of CM proliferation in PD168393-treated wild-type sibling (n=6) and inhbaa OE (n=6) ventricles at 120 hpf. All cell counts were performed on non-overlapping confocal planes (thickness, 1?m) (data are mean � s.e.m., ***P ? 0.001 - Student?s t-test, two-tailed). Scale bars, 20 ?m. vent., ventricle; atr., atrium. |

ZFIN is incorporating published figure images and captions as part of an ongoing project. Figures from some publications have not yet been curated, or are not available for display because of copyright restrictions. |