
Fig. 1
- ID
- ZDB-FIG-180716-23
- Publication
- Kaur et al., 2018 - let-7 MicroRNA-Mediated Regulation of Shh Signaling and the Gene Regulatory Network Is Essential for Retina Regeneration
- Other Figures
- All Figure Page
- Back to All Figure Page
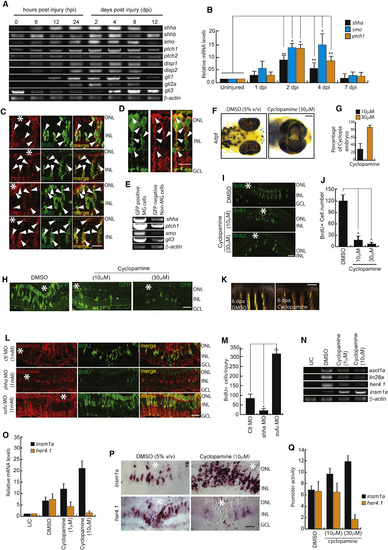
Shh Signaling Is Necessary for MG Dedifferentiation in the Injured Retina (A and B) RT-PCR (A) and qPCR (B) analysis of Shh signaling component genes in the retina at indicated time points post-injury; n = 6 biological replicates. ∗p < 0.001; ∗∗p < 0.003. (C and D) Immunofluorescence (IF) microscopy images of Shh signaling components in wild-type BrdU+ MGPCs (C), and Shh expression in 1016 tuba1a:GFP transgenic fish at 4 dpi (D). Arrowheads mark protein expression in cells in (C) and (D). (E) RT-PCR assay of Shh signaling component genes in GFP-positive MGPCs and the rest of the cells from 1016 tuba1a:GFP transgenic retina at 4 dpi. (F and G) Bright-field (BF) images of 4-days post-fertilized embryos treated with 5% (v/v) DMSO and 30 μM cyclopamine (F), and quantification of the number of cyclopia embryos (G). (H–J) IF microscopy images showing a dose-dependent decline in GFP+ and BrdU+ MGPCs in 1016 tuba1a:GFP transgenic (H) and wild-type (I) retinae, respectively, at 4 dpi upon cyclopamine treatment, which is quantified in (J). (K) BF microscopy images of blastema during caudal fin regeneration in cyclopamine-treated wild-type zebrafish at 6 days post-amputation. (L and M) IF microscopy images of retinal sections with shha or sufu knockdowns (L), and quantification of the number of BrdU+ cells at the injury site (M). ∗p < 0.0001; n = 4 biological replicates. Lissamine tag on MO shows red fluorescence in (L). (N–P) RT-PCR analysis of ascl1a, lin28a, her4.1, and insm1a in uninjured control, 2.5 dpi DMSO-treated, and 2.5 dpi cyclopamine-treated retina (N); qPCR analysis of mRNA levels of insm1a and her4.1 with cyclopamine treatment (O); and BF images of corresponding mRNA in situ hybridization (ISH) of these genes in the retina at 4 dpi (P). (Q) Single-cell-stage embryos were injected with insm1a:luciferase or her4.1:luciferase vectors along with Renilla luciferase mRNA for normalization and then treated with cyclopamine for 24 hr before lysing for quantification of insm1a and her4.1 promoter activity using a dual luciferase assay. Scale bars represent 10 μm in (C), (D), (H), (I), (L), and (P) and 500 μm in (F) and (K). Asterisk indicates the injury site (C, H, I, L, and P). Error bars represent SD. ∗p < 0.0001 (J); ∗p < 0.001 (M). n = 6 biological replicates. GCL, ganglion cell layer; INL, inner nuclear layer; ONL, outer nuclear layer; UC, uninjured control. See also Figures S1, S2, S6, and S7. |
| Genes: | |
|---|---|
| Antibodies: | |
| Fish: | |
| Conditions: | |
| Anatomical Terms: | |
| Stage: | Adult |
| Fish: | |
|---|---|
| Conditions: | |
| Knockdown Reagents: | |
| Observed In: | |
| Stage Range: | Day 4 to Adult |