
FIGURE
Fig. S2
Fig. S2
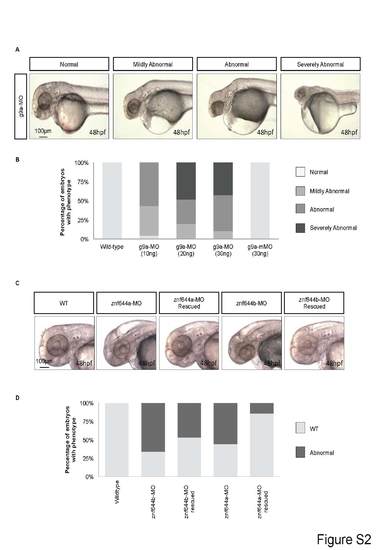
(A) Lateral views of WT or g9a morphant embryos illustrating the varying degrees of developmental defects observed. (B) Frequency at which the normal/abnormal morphologies are observed in WT or the indicated g9a-MO injected embryos. The mismatch control MO (g9a-mMO) is indicated. (C) Lateral views of WT, znf644a, or znf644b morphant embryos at 48 hpf as well as rescue assays in which the respective cognate mRNA were co-injected. (D) The frequency at which the WT or abnormal phenotypes were observed in indicated embryos. |
Expression Data
Expression Detail
Antibody Labeling
Phenotype Data
| Fish: | |
|---|---|
| Knockdown Reagents: | |
| Observed In: | |
| Stage: | Long-pec |
Phenotype Detail
Acknowledgments
This image is the copyrighted work of the attributed author or publisher, and
ZFIN has permission only to display this image to its users.
Additional permissions should be obtained from the applicable author or publisher of the image.
Full text @ Stem Cell Reports