
- Title
-
Sephin1 reduces TDP-43 cytoplasmic mislocalization and improves motor neuron survival in ALS models
- Authors
- Abgueguen, E., Tortarolo, M., Rouviere, L., Marcuzzo, S., Camporeale, L., Henriques, A., Pasetto, L., Culley, G.R., Bonetto, V., Marian, A., Lejeune, B.L., Visbecq, A., Lauria, G., Kabashi, E., Callizot, N., Bendotti, C., Miniou, P.Y.
- Source
- Full text @ Life Sci Alliance
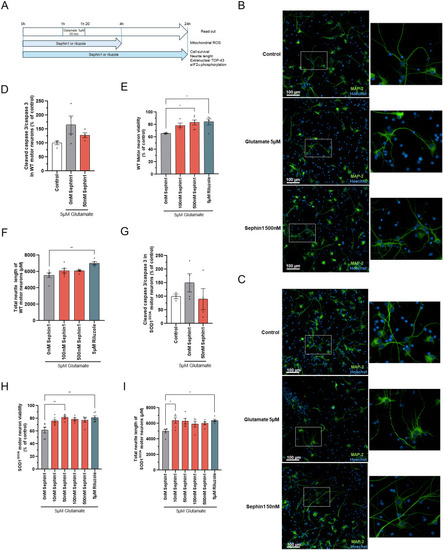
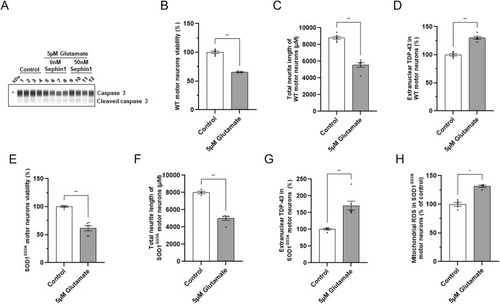
Sephin1 protects primary WT and SOD1G93A rat motor neurons against glutamate injury. Source data are available for this figure. |

Sephin1 reduces mitochondrial ROS without modulating calcium flux or the phosphorylation of eIF2α in primary rat motor neurons against glutamate intoxication. Source data are available for this figure. |
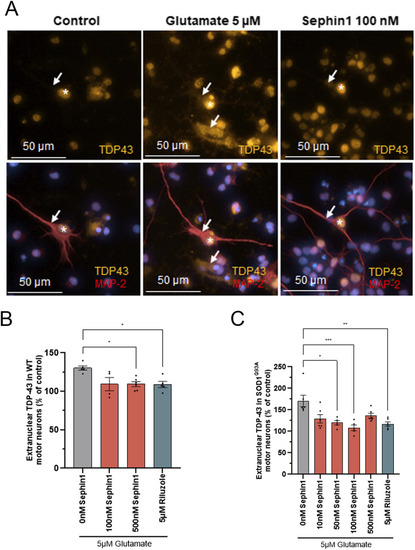
Sephin1 reduces extranuclear TDP-43 localization in primary motor neurons from WT and SOD1G93A rats. |
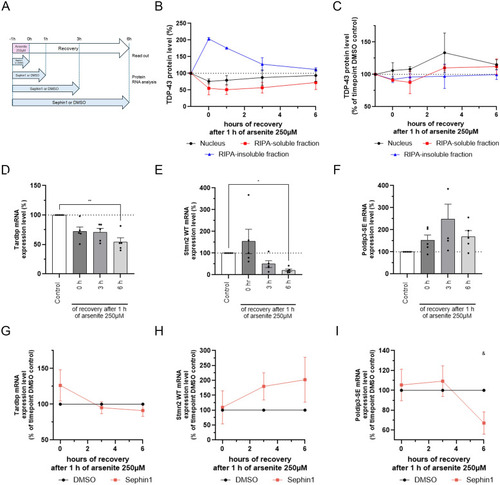
Sephin1 reduces abnormal splicing during the recovery period after 1 h of arsenite stress. |
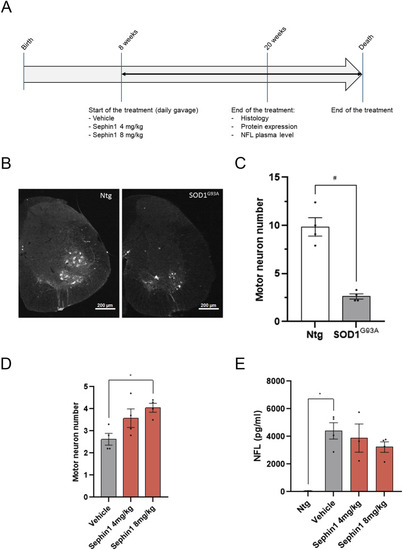
Sephin1 improves survival of spinal cord motor neurons from SOD1G93A female mice at 20 wk of age. |
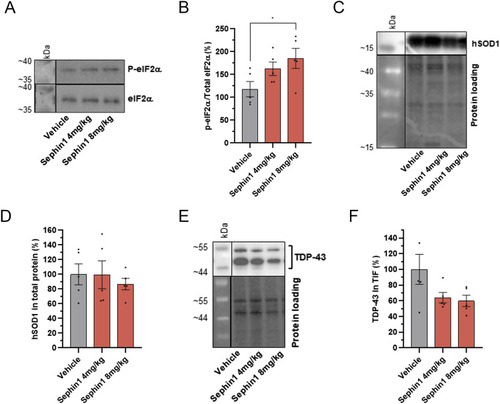
Sephin1 increases eIF2α phosphorylation level and reduces TDP-43 in TIF from spinal cord motor neurons of SOD1G93A female mice at 20 wk of age. Source data are available for this figure. |
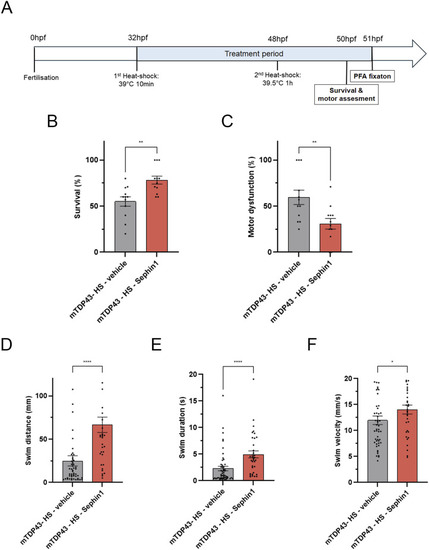
Sephin1 improves survival and locomotor function in zebrafish embryos expressing mutant TDP-43G348C protein. |
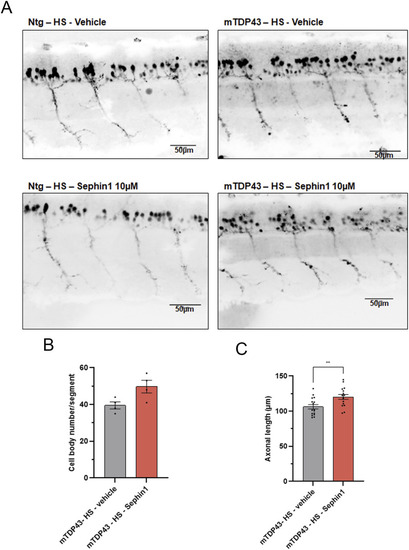
Sephin1 improves motor neurons survival and axonal length in zebrafish embryos expressing mutant TDP-43G348C protein. |
Glutamate intoxication decreases cell viability, neurite network integrity, and increases extranuclear TDP-43 in primary motor neurons from WT and SOD1G93A rats. |

Sephin1 reduces TDP-43 translocation following arsenite treatment. Source data are available for this figure. |

No improvement of motor function or survival by Sephin1 treatment in SOD1G93A female mice. |
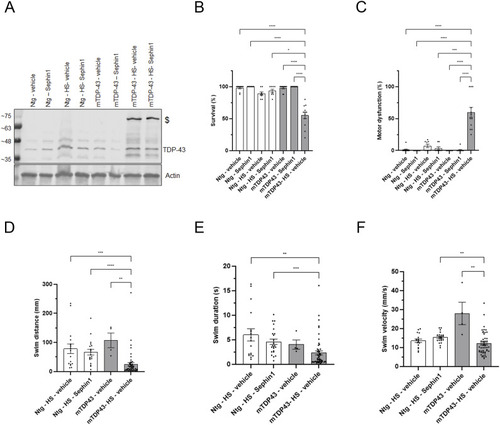
Impact of TDP-43G348C protein expression in zebrafish embryos on survival and locomotor function. Source data are available for this figure. |
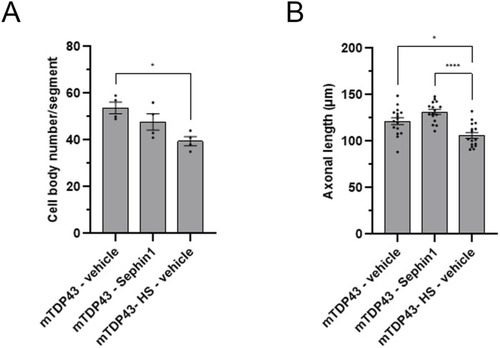
Impact of TDP-43G348C protein expression in motor neurons of zebrafish embryos. |
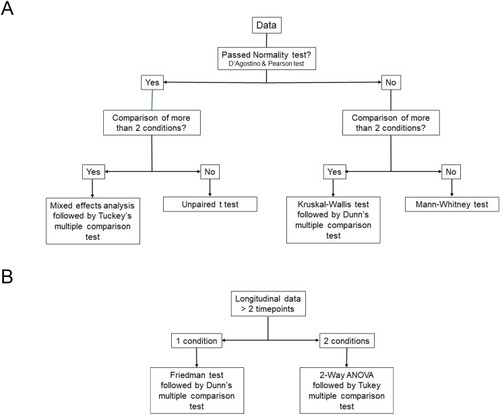
Decision tree for statistical analysis applied to this study. |