IMAGE

Figure S2.

ID
ZDB-IMAGE-250705-22
Source
Figures for Abgueguen et al., 2025
Image
Figure Caption

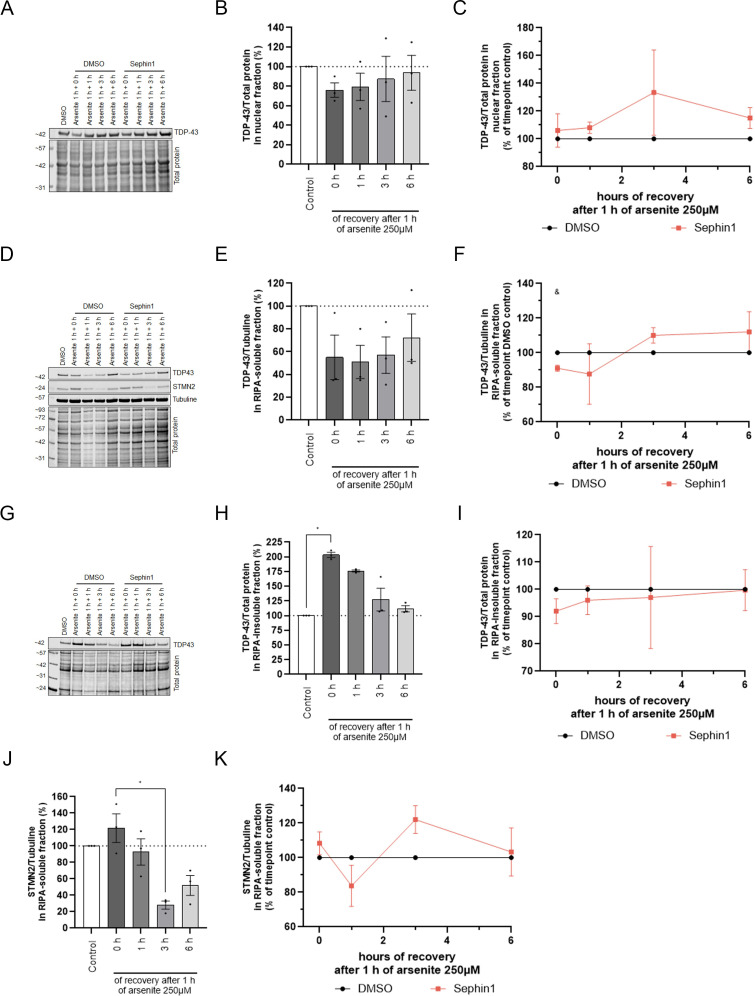
Figure S2. Sephin1 reduces TDP-43 translocation following arsenite treatment.

(A) Representative picture of immunoblots of TDP-43 in nuclear fraction from SH-SY5Y cells treated for 1 h with arsenite 250 μM and recovered for 0, 1, 3, or 6 h in fresh medium containing DMSO or Sephin1 10 μM. (B) Expression level of TDP-43 in nuclear fraction during the recovery period after 1 h of arsenite treatment (n = 3 independent experiments). (C) Expression level of TDP-43 in nuclear fraction during the recovery period after 1 h of arsenite treatment in SH-SY5Y treated with Sephin1 10 μM compared with SH-SY5Y treated with DMSO (n = 3 independent experiments). (D) Representative picture of immunoblot of TDP-43 and STMN2 in RIPA-soluble fraction from SH-SY5Y cells treated for 1 h with arsenite 250 μM and recovered for 0, 1, 3, or 6 h in fresh medium containing DMSO or Sephin1 10 μM. (E) Expression level of TDP-43 in RIPA-soluble fraction during the recovery period after 1 h of arsenite treatment (n = 3 independent experiments). (F) Expression level of TDP-43 in RIPA-soluble fraction during the recovery period after 1 h of arsenite treatment in SH-SY5Y treated with Sephin1 10 μM compared with SH-SY5Y treated with DMSO (n = 3 independent experiments). (G) Representative picture of immunoblot of TDP-43 in RIPA-insoluble fraction from SH-SY5Y cells treated for 1 h with arsenite 250 μM and recovered for 0, 1, 3, or 6 h in fresh medium containing DMSO or Sephin1 10 μM. (H) Expression level of TDP-43 in RIPA-insoluble fraction during the recovery period after 1 h of arsenite treatment (n = 3 independent experiments). (I) Expression level of TDP-43 in RIPA-insoluble fraction during the recovery period after 1 h of arsenite treatment in SH-SY5Y treated with Sephin1 10 μM compared with SH-SY5Y treated with DMSO (n = 3 independent experiments). (J) Expression level of STMN2 in RIPA-soluble fraction during the recovery period after 1 h of arsenite treatment (n = 3 independent experiments). (K) Expression level of STMN2 in RIPA-soluble fraction during the recovery period after 1 h of arsenite treatment in SH-SY5Y treated with Sephin1 10 μM compared with SH-SY5Y treated with DMSO (n = 3 independent experiments). *P < 0.05 Friedman test followed by Dunn’s multiple comparison test; &P < 0.05 two-Way ANOVA followed by Tukey’s multiple comparison test. Mean ± SEM.

Source data are available for this figure.

Acknowledgments
This image is the copyrighted work of the attributed author or publisher, and ZFIN has permission only to display this image to its users. Additional permissions should be obtained from the applicable author or publisher of the image. Full text @ Life Sci Alliance