FIGURE SUMMARY
Title

Ontogeny of Thyroid Hormone Signaling in the Retina of Zebrafish: Effects of Thyroidal Status on Retinal Morphology, Cell Survival, and Color Preference

Authors
Lazcano, I., Pech-Pool, S.M., Maldonado-Lira, M.F., Olvera, A., Darras, V.M., Orozco, A.
Source
Full text @ Int. J. Mol. Sci.

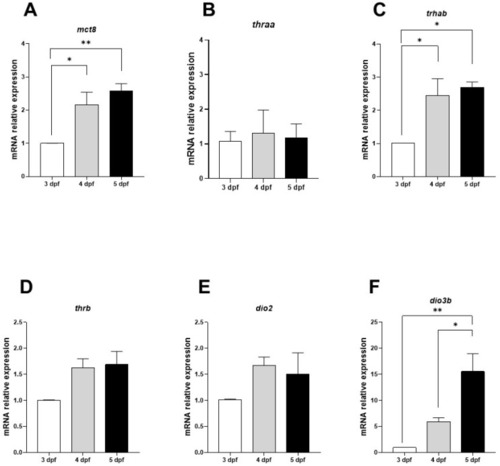
Retinal mRNA expression of mct8, thraa, thrab, thrb, dio2, and dio3b at 3, 4, and 5 dpf. (AF) Each bar represents the mean fold change ± SEM. Data were obtained from four independent experiments, and each sample was analyzed in duplicate. Ribosomal 18S and actin mRNA were used as reference genes to apply the 2−ΔΔCT formula. Statistical analyses were performed using one-way ANOVA and Tukey post hoc tests. Significant differences when comparing the control (3 dpf) to 4 and 5 dpf were indicated. * = p < 0.05, ** = p < 0.01.

EXPRESSION / LABELING:
Genes:
Fish:
Anatomical Term:
Stage Range: Protruding-mouth to Day 5

Comparison of dio3b and thrb crispants at retinal level. (A) Electropherograms from a fragment of the PCR amplicon sequence for dio3b and thrb of the vehicle-microinjected controls and the corresponding crispants. At the top, the sgRNA sequence is denoted, and the PAM sequence is highlighted in red. In the crispants, a decrease in the resolution of the electropherogram is evident around the canonical cutting site indicated with an arrow and a dotted line. (B) Representative histological cross-sections of retinas of vehicle-injected controls and thrb and dio3 crispants (5–7 retinas per condition) stained with H&E. (C) Amplification of the GCL (insets in (B)). (D) Quantification of the number of cells/1000 µm2. ONL = outer nuclear layer, INL = inner nuclear layer, GCL = ganglion cell layer. Statistical analyses were performed using one-way ANOVA and Tukey post hoc tests. * = p < 0.05. Scale bar = 20 µm.

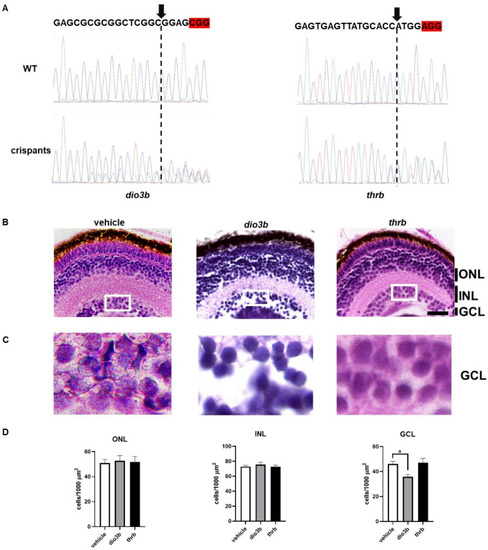
Thyroid status modifies the number of cells in the GCL and INL. (A) Representative histological retina cross-sections of control, IOP-treated, or T3-treated zebrafish larvae at 5 dpf stained with H&E. (B) Amplification of the INL and GCL (insets in (A)). (C) Quantification of the number of cells/1000 µm2 (n = 6) from the different experimental groups. Bars represent the mean ± SEM. Statistical analyses were performed using one-way ANOVA and Tukey post hoc tests. * = p < 0.05, ** = p < 0.01. ONL = outer nuclear layer, INL = inner nuclear layer, GCL = ganglion cell layer. Scale bar = 20 µm.

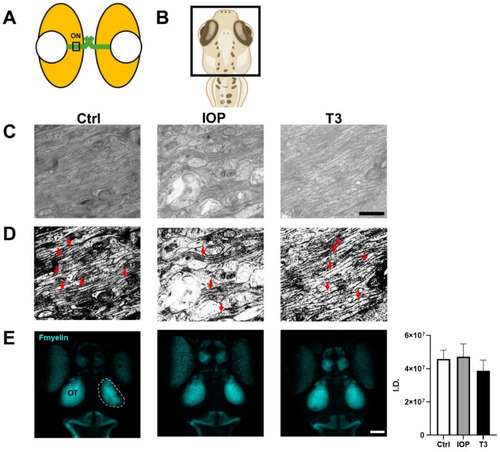
Thyroid status modifies the number of GCL axons but not the morphology of the optic tectum. (A) Illustrative representations of the zebrafish larvae eye indicating the optic nerve (ON) area photographed in (C,D). (B) Dorsal view representation to depict the Fmyelin stained area in (E). (C) Transmission electron micrographs of the optic nerve at 5 dpf and (D) their corresponding threshold. Axons crossing the optic nerve are fewer after IOP treatment, as indicated with the red arrows in (D). (E) Maximum intensity projections of the Fmyelin staining in the optic tectum (OT, circled in dotted line). Quantification from left and right OT is shown as integraded density (I.D.) from a Z-projection. Bars represent the mean ± SEM. n = 6 animals per group. Scale bar = 2 µm in (C) and 10 µm in (E).

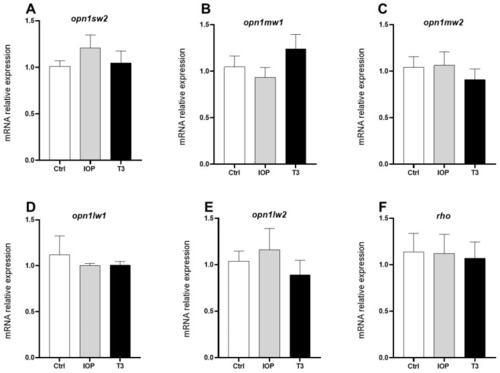
Effect of T3 and IOP treatments upon opsin mRNA expression in 5 dpf zebrafish larvae. (AF) No significant statistical differences were observed when comparing the control (Ctrl) to T3-treated and IOP-treated groups. Each bar represents the mean fold change ± SEM from four independent experiments, and each sample was analyzed in duplicate. Ribosomal 18S and actin mRNA were used as reference genes to apply the 2−ΔΔCT formula. Statistical analysis was performed using one-way ANOVA with multiple comparisons and Tukey post hoc tests.

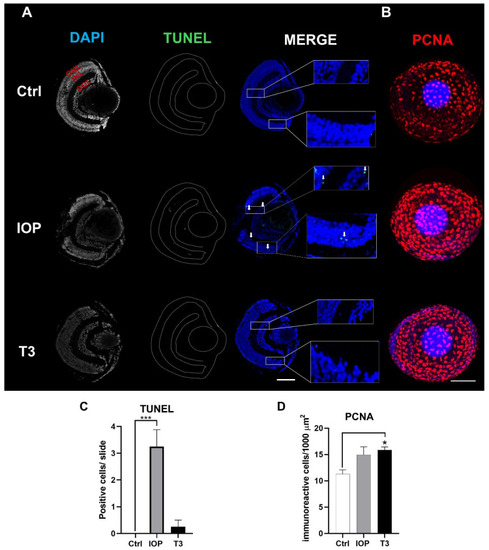
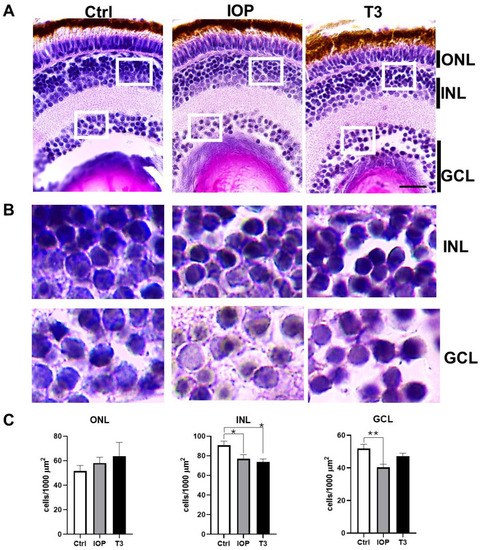
Cell death and cell proliferation after IOP and T3 treatments. (A) Microphotographs of sections of 5 dpf zebrafish retina showing apoptotic cells in retinal layers revealed by the TUNEL assay (green) and counterstaining with DAPI (blue). IOP induces an increase in apoptotic cells (white arrows) in the GCL and INL. (B) Confocal 3D reconstruction of a PCNA (red) whole mount retinal assay showing a significant increase in the proliferation profile in T3-treated larvae. (C) Quantification of apoptosis rate on the whole slide in the control (Ctrl), IOP, or T3 groups. (D) The quantification of whole-eye PCNA immunoreactivity in the control (Ctrl), IOP, or T3 groups. Bars represent the mean ± SEM. Scale bar = 50 µm. Statistical analysis was performed using one-way ANOVA with multiple comparisons and Tukey post hoc tests. * = p < 0.05, *** = p < 0.001.

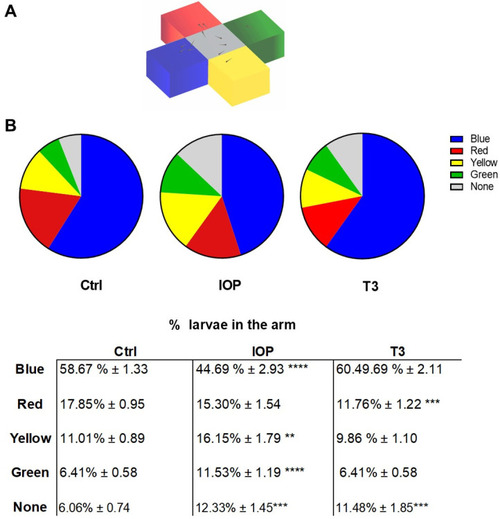
IOP and T3 modify the color preference paradigm. (A) Cross color maze and preference tests used in this study based on Park et al., 2016 [28]. (B) Color preference paradigm showing that IOP and T3 modify the pattern of color preference when compared to the control (ctrl) group (n ≥ 7 independent assays). Data are the mean ± SEM. ** = p < 0.01, *** = p < 0.001, **** = p < 0.0001.

Acknowledgments
This image is the copyrighted work of the attributed author or publisher, and ZFIN has permission only to display this image to its users. Additional permissions should be obtained from the applicable author or publisher of the image. Full text @ Int. J. Mol. Sci.