
Figure 4
- ID
- ZDB-IMAGE-241129-55
- Publication
- Lazcano et al., 2024 - Ontogeny of Thyroid Hormone Signaling in the Retina of Zebrafish: Effects of Thyroidal Status on Retinal Morphology, Cell Survival, and Color Preference
- All Figures
- Figures for Lazcano et al., 2024
|
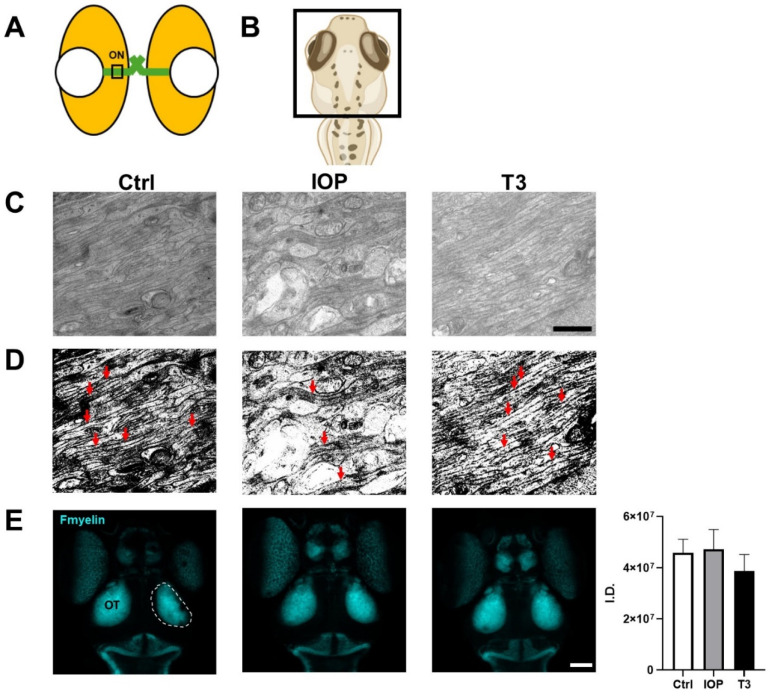
Figure 4
Thyroid status modifies the number of GCL axons but not the morphology of the optic tectum. (