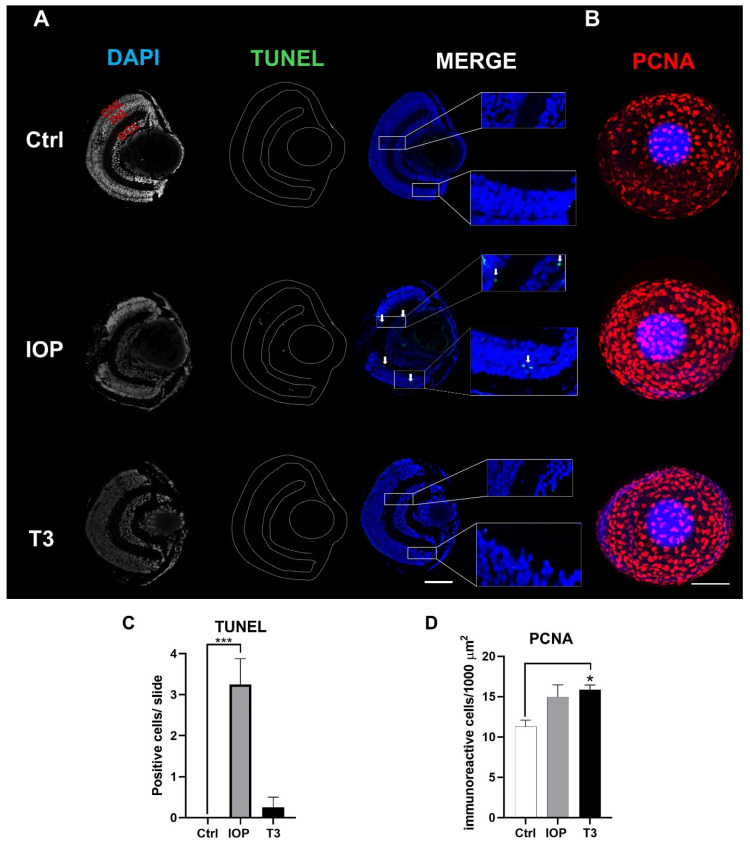
Cell death and cell proliferation after IOP and T3 treatments. (A) Microphotographs of sections of 5 dpf zebrafish retina showing apoptotic cells in retinal layers revealed by the TUNEL assay (green) and counterstaining with DAPI (blue). IOP induces an increase in apoptotic cells (white arrows) in the GCL and INL. (B) Confocal 3D reconstruction of a PCNA (red) whole mount retinal assay showing a significant increase in the proliferation profile in T3-treated larvae. (C) Quantification of apoptosis rate on the whole slide in the control (Ctrl), IOP, or T3 groups. (D) The quantification of whole-eye PCNA immunoreactivity in the control (Ctrl), IOP, or T3 groups. Bars represent the mean ± SEM. Scale bar = 50 µm. Statistical analysis was performed using one-way ANOVA with multiple comparisons and Tukey post hoc tests. * = p < 0.05, *** = p < 0.001.
This image is the copyrighted work of the attributed author or publisher, and
ZFIN has permission only to display this image to its users.
Additional permissions should be obtained from the applicable author or publisher of the image.
Full text @ Int. J. Mol. Sci.
Your Input Welcome
Thank you for submitting comments. Your input has been emailed to ZFIN curators who may contact you if
additional information is required.
Oops. Something went wrong. Please try again later.