
IMAGE
Figure 1
- ID
- ZDB-IMAGE-241129-52
- Genes
- Publication
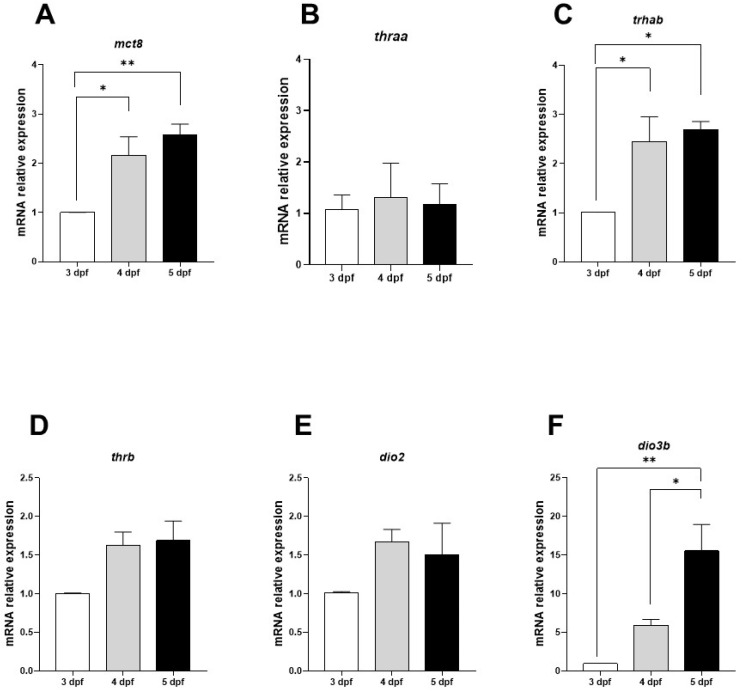
- Lazcano et al., 2024 - Ontogeny of Thyroid Hormone Signaling in the Retina of Zebrafish: Effects of Thyroidal Status on Retinal Morphology, Cell Survival, and Color Preference
- All Figures
- Figures for Lazcano et al., 2024
Image
|
Figure Caption
Figure 1
Retinal mRNA expression of
Figure Data
Acknowledgments
This image is the copyrighted work of the attributed author or publisher, and
ZFIN has permission only to display this image to its users.
Additional permissions should be obtained from the applicable author or publisher of the image.
Full text @ Int. J. Mol. Sci.