FIGURE

Figure 4

ID
ZDB-FIG-241129-51
Publication
Lazcano et al., 2024 - Ontogeny of Thyroid Hormone Signaling in the Retina of Zebrafish: Effects of Thyroidal Status on Retinal Morphology, Cell Survival, and Color Preference
Other Figures
All Figure Page
Back to All Figure Page
Figure 4

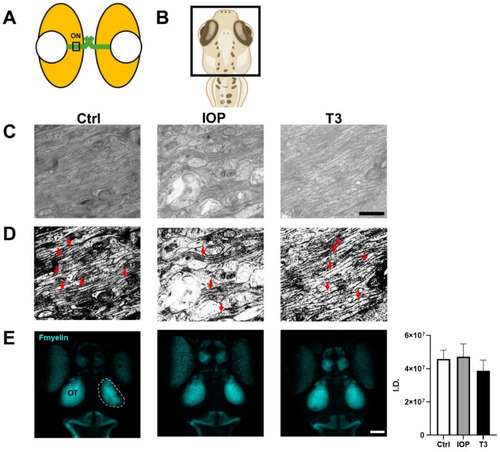
Thyroid status modifies the number of GCL axons but not the morphology of the optic tectum. (A) Illustrative representations of the zebrafish larvae eye indicating the optic nerve (ON) area photographed in (C,D). (B) Dorsal view representation to depict the Fmyelin stained area in (E). (C) Transmission electron micrographs of the optic nerve at 5 dpf and (D) their corresponding threshold. Axons crossing the optic nerve are fewer after IOP treatment, as indicated with the red arrows in (D). (E) Maximum intensity projections of the Fmyelin staining in the optic tectum (OT, circled in dotted line). Quantification from left and right OT is shown as integraded density (I.D.) from a Z-projection. Bars represent the mean ± SEM. n = 6 animals per group. Scale bar = 2 µm in (C) and 10 µm in (E).

Expression Data

Expression Detail
Antibody Labeling
Phenotype Data
Fish:
Condition:
Observed In:
Stage: Day 5

Phenotype Detail
Acknowledgments
This image is the copyrighted work of the attributed author or publisher, and ZFIN has permission only to display this image to its users. Additional permissions should be obtained from the applicable author or publisher of the image. Full text @ Int. J. Mol. Sci.