
- Title
-
ADA2 regulates inflammation and hematopoietic stem cell emergence via the A2bR pathway in zebrafish
- Authors
- Brix, A., Belleri, L., Pezzotta, A., Pettinato, E., Mazzola, M., Zoccolillo, M., Marozzi, A., Monteiro, R., Del Bene, F., Mortellaro, A., Pistocchi, A.
- Source
- Full text @ Commun Biol
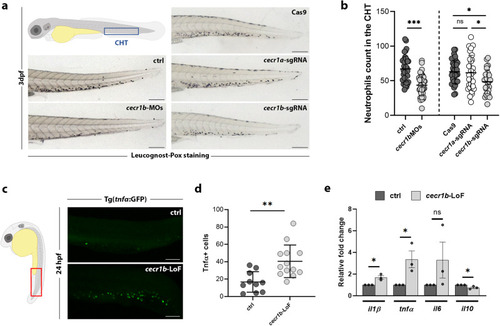
Generation and validation of the EXPRESSION / LABELING:
PHENOTYPE:
|
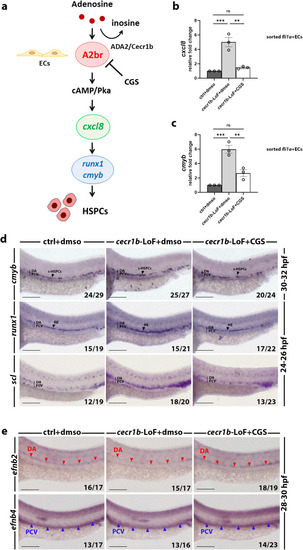
Analysis and modulation of the A2bR pathway, which is dysregulated in the endothelium of |
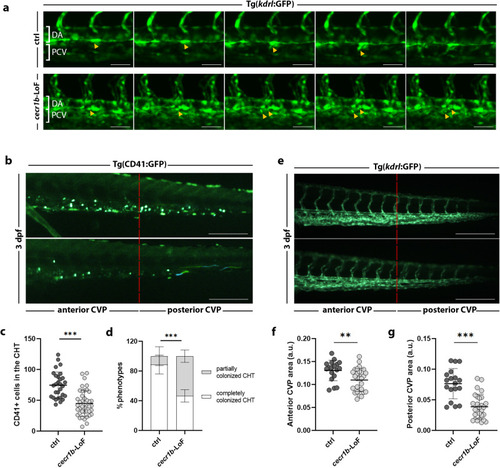
Defective HSPC emergence from HE and altered CHT colonization. EXPRESSION / LABELING:
PHENOTYPE:
|
Analysis of the defective HSPC population in the CHT of EXPRESSION / LABELING:
PHENOTYPE:
|
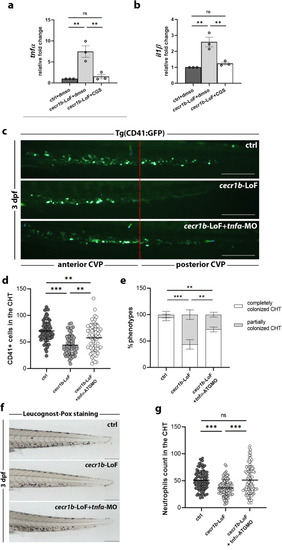
Analysis of the defective HSPC population in the CHT of RT-qPCR expression levels of ( EXPRESSION / LABELING:
PHENOTYPE:
|
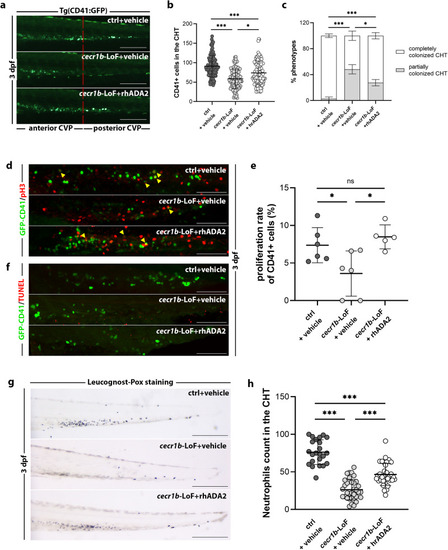
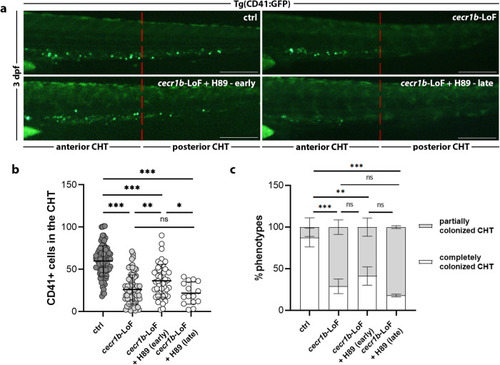
Recovery of the EXPRESSION / LABELING:
PHENOTYPE:
|
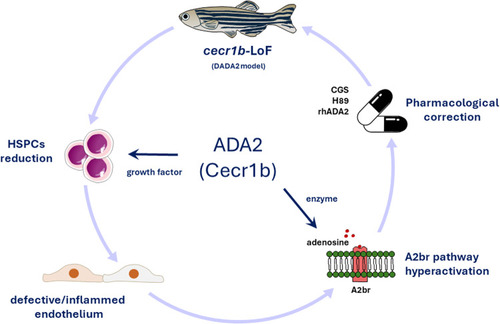
ADA2 has a role in regulating inflammation and HSPC emergence via the A2bR pathway in the Schematic representation of the function of ADA2 validated in the |