|
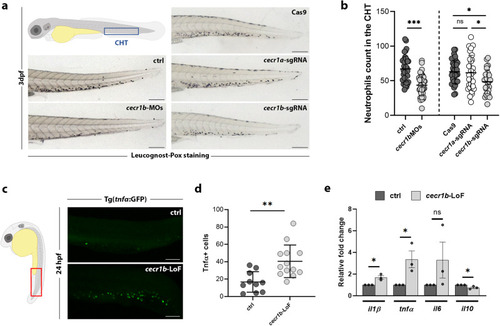
Generation and validation of the cecr1b-LoF zebrafish models. a Representative brightfield images of the CHT of 3 dpf embryos stained with the Leucognost-Pox colorimetric assay for neutrophils detection. Scale bar: 300 microns. b Quantification of neutrophils number in the CHT. Each dot represents the count of a single embryo (mean ± SD). Statistical significance was assessed by two-tailed, unpaired t-student test and Ordinary one-way ANOVA test with Tukey’s correction for cecr1b-MOs embryos (ctrl, n = 38 embryos; cecr1b-MOs n = 37 embryos) and cecr1a/cecr1b-sgRNA embryos (Cas9, n = 35 embryos; cecr1a-sgRNA, n = 28 embryos; cecr1b-sgRNA, n = 29 embryos), respectively; ***, p < 0.001; *, p < 0.05; ns, not significant (c) Representative confocal images of Tnfα expressing cells in the trunk-tail region of 24–26 hpf embryos. Magnification: 20X. Scale bar: 100 microns. d Count of Tnfα+ cells in the trunk region. Each dot in the graph represents the count of a single embryo (mean ± SD). Statistical significance was assessed by two-tailed, unpaired t-student test; **p < 0.002 (ctrl, n = 10 embryos; cecr1b-LoF, n = 13 embryos) (e) RT-qPCR results of pro-inflammatory (il1β, tnfα, il6) and anti-inflammatory (il10) cytokines in 3 dpf embryos (mean ± SEM). n = 3 biologically independent experiments. Statistical significance was assessed by a two-tailed unpaired t-student test; *p < 0.05, ns not significant.
|