|
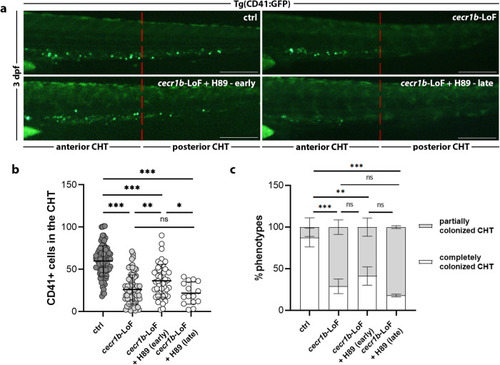
Analysis of the defective HSPC population in the CHT of cecr1b-LoF embryos and its correction through A2bR modulation. a Representative fluorescence images of the CHT region of 3 dpf Tg(CD41:GFP) embryos. Scale bar: 150 microns. b Quantification of CD41+ HSPCs in the CHT in cecr1b-LoF embryos treated with H89 from early or late time. Each dot represents the count of a single embryo. Data are presented as mean ± SD. Statistical significance was assessed by Ordinary one-way ANOVA test with Tukey’s correction; ***, p < 0.001; **, p < 0.002; *, p < 0.05; ns not significant (ctrl, n = 96 embryos; cecr1b-LoF, n = 82 embryos; cecr1b-LoF+H89 (early), n = 52 embryos; cecr1b-LoF+H89 (late), n = 15 embryos). c Histogram showing the proportion of embryos showing complete or defective CHT colonization in the different experimental conditions (mean of biological experimental replicates±SD). n = 3 biologically independent experiments. Statistical significance was assessed by multiple Chi-Square analyses (Fisher’s exact test, confidence interval 99%); ***p < 0.001; **p < 0.002; *p < 0.05; ns not significant.
|