|
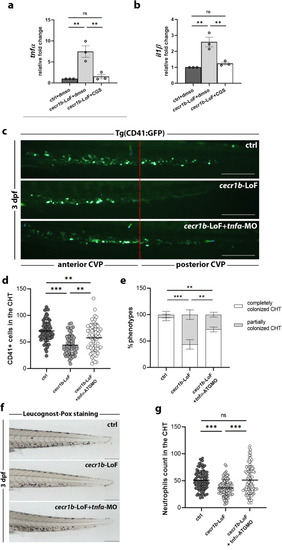
Analysis of the defective HSPC population in the CHT of cecr1b-LoF embryos and its correction trough tnfα modulation. RT-qPCR expression levels of (a) tnfα and (b) il1β measured in endothelial cells sorted from 30-32 hpf Tg(fli1a:GFP) ctrl and cecr1b-LoF embryos untreated or treated with CGS. Data are presented as mean ± SEM. n = 3 biologically independent experiments. Statistical significance was assessed by Ordinary one-way ANOVA test with Tukey’s correction; **p < 0.002; ns, not significant. c Representative fluorescence images of the CHT region of 3 dpf Tg(CD41:GFP) embryos belonging to the different experimental categories. Scale bar: 150 microns. The red dotted line divides the CHT region into the anterior and posterior parts. d Quantification graph of CD41+ HSPCs in the CHT of ctrl 3 dpf embryos belonging to the different experimental categories. Each dot represents the count of a single embryo. Data are presented as mean ± SD. Statistical significance was assessed by Ordinary one-way ANOVA test with Tukey’s correction; ***, p < 0.001; **, p < 0.002; (ctrl, n = 62 embryos; cecr1b-LoF, n = 48 embryos; cecr1b-LoF+tnfα-ATGMO, n = 58 embryos); e Histogram showing the proportion of embryos with complete or defective CHT colonization in the different experimental conditions (mean ± SD). n = 3 biologically independent experiments. Statistical significance was assessed by multiple two-sided Chi-Square analysis (confidence interval 99%); ***p < 0.001; *p < 0.05. Representative bright-field images (f) and quantification graph (g) of neutrophils stained with the Leucognost-Pox colorimetric assay in the CHT of 3 dpf embryos. Scale bar: 300 microns. Each dot represents the count of a single embryo. Data are presented as mean ± SD. Statistical significance statistical significance was assessed by Ordinary one-way ANOVA test with Tukey’s correction; ***p < 0.001, ns, not significant (ctrl, n = 100 embryos; cecr1b-LoF, n = 107 embryos; cecr1b-LoF+tnfα-ATGMO, n = 104 embryos).
|