|
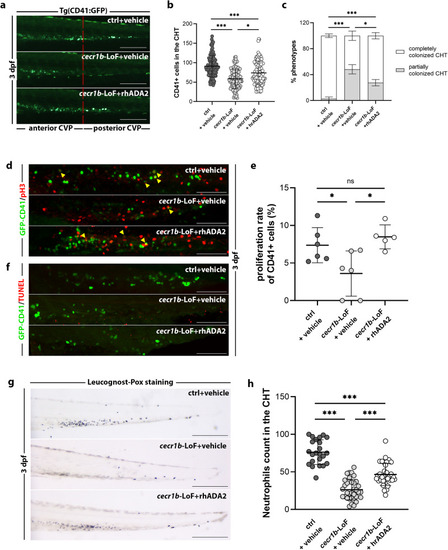
Recovery of the cecr1b-dependent hematopoietic phenotypes through supplementation of the rhADA2. a Representative fluorescence images of the CHT region of 3 dpf Tg(CD41:GFP) embryos belonging to the different experimental conditions. The red dotted line divides the CHT region into the anterior and posterior parts. Scale bar: 150 microns. b Quantification graphs of CD41+HSPC number in the CHT region of the embryos. Each dot represents the count of a single embryo (mean ± SD). Statistical significance was assessed by Ordinary one-way ANOVA test with Tukey’s correction; ***p < 0.001; *p < 0.05 (ctrl, n = 109 embryos; cecr1b-LoF, n = 109 embryos; cecr1b-LoF+rhADA2, n = 107 embryos). c Histogram showing the proportions of embryos showing complete or defective CHT colonization (mean ± SD). n = 5 biologically independent experiments. Statistical significance was assessed by multiple two-sided Chi-Square analysis (Fisher’s exact test, confidence interval 99%); ***p < 0.001; *p < 0.05. d Representative confocal images of the CHT region of 3 dpf embryos stained for CD41/GFP and the proliferation marker pH3 with double immuno-fluorescence. Yellow arrowheads indicate double CD41-GFP+/pH3+ cells. Magnification: 20X. Scale bar: 100 microns. e The proliferation rate was estimated as the number of double CD41-GFP+/pH3+ cells normalized on the total number of CD41-GFP+ in the CHT of each embryo. Statistical significance was assessed by Ordinary one-way ANOVA test with Tukey’s correction; *p < 0.05, ns not significant (ctrl, n = 6 embryos; cecr1b-LoF, n = 6 embryos; cecr1b-LoF+rhADA2, n = 5 embryos). f Representative confocal images of the CHT region of 2.5 dpf embryos stained with the apoptotic TUNEL assay. Magnification: 20×. Scale bar: 100 microns (ctrl, n = 4 embryos; cecr1b-LoF, n = 4 embryos; cecr1b-LoF, n = 4 embryos). g, h Representative images and quantification of neutrophils stained with the Leucognost-Pox colorimetric assay in the CHT of 3 dpf embryos. Scale bar: 300 microns. Each dot in the graph represents the count of a single embryo (mean ± SD). Statistical significance was assessed by Ordinary one-way ANOVA test with Tukey’s correction; ***p < 0.001 (ctrl, n = 24 embryos; cecr1b-LoF, n = 34 embryos; cecr1b-LoF+rhADA2, n = 36 embryos).
|