
Fig. 6
- ID
- ZDB-IMAGE-240524-106
- Genes
- Publication
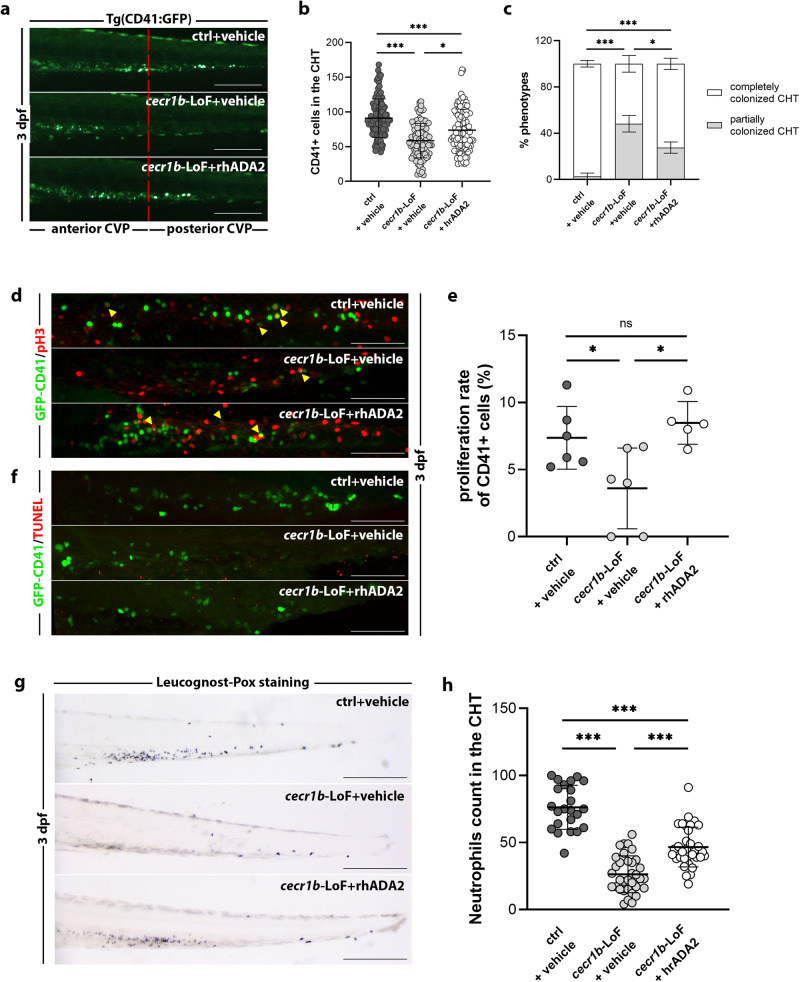
- Brix et al., 2024 - ADA2 regulates inflammation and hematopoietic stem cell emergence via the A2bR pathway in zebrafish
- All Figures
- Figures for Brix et al., 2024
|
Fig. 6
Recovery of the