|
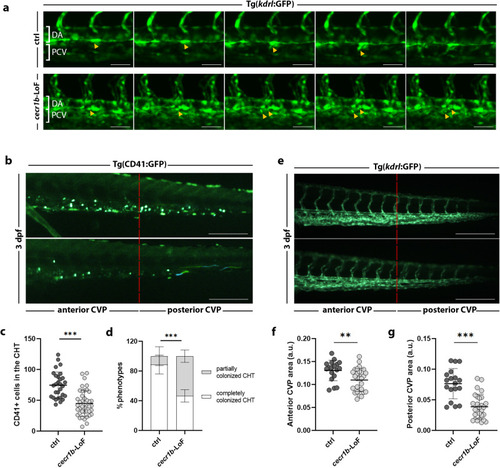
Defective HSPC emergence from HE and altered CHT colonization. a Sequence of images from time-lapse experiments on Tg(kdrl:GFP) ctrl and cecr1b-LoF embryos from 30 hpf. Yellow arrowheads indicate HSPCs emerging from the ventral wall of the dorsal aorta in the trunk region. DA dorsal aorta, PCV posterior cardinal vein. Magnification 20X, scale bar = 50 microns. b Representative fluorescence images of the CHT region of 3 dpf Tg(CD41:GFP) ctrl and cecr1b-LoF embryos. The red dotted line divides the CHT into the anterior and posterior parts. Scale bar = 150 microns. c Quantification graph of the CD41+ HSPC number (mean ± SD) in the CHT region of ctrl and cecr1b-LoF embryos at the stage of 3 dpf. Each dot represents the count of a single embryo. Statistical significance was assessed by a two-tailed, unpaired t-student test. ***p < 0.001. (ctrl, n = 29 embryos; cecr1b-LoF, n = 41 embryos). d Histograms showing the percentage of embryos with completely colonized (white) or partially colonized (gray) CHT. Data are presented as the mean ± SD of independent experiments. n = 3 biologically independent experiments. Statistical significance was assessed with the Chi-square test (Fisher’s exact test, confidence interval 95%). ***p < 0.001. e Representative fluorescence images of the CVP region of 3 dpf Tg(kdrl:GFP). The red dotted line divides the CVP region into the anterior and posterior parts. Quantification graph of the GFP+ area in the (f) anterior and (g) posterior part of the CVP. Each dot represents the count of a single embryo. Data are presented as mean ± SD. Statistical significance was assessed with an unpaired t-student-test. ***p < 0.001; **p < 0.002 (ctrl, n = 18 embryos; cecr1b-LoF, n = 28 embryos).
|