FIGURE SUMMARY
Title

TFG mutation induces haploinsufficiency and drives axonal Charcot-Marie-Tooth disease by causing neurite degeneration

Authors
Chen, X., Liu, F., Chen, K., Wang, Y., Yin, A., Kang, X., Yang, S., Zhao, H., Dong, S., Li, Y., Chen, J., Wu, Y.
Source
Full text @ CNS Neurosci Ther

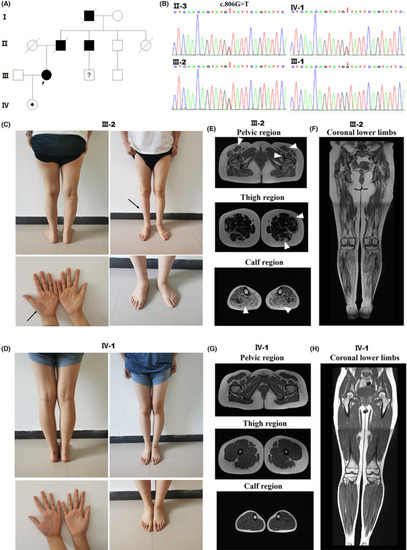
Detection of TFG p. G269V in a CMT2 family and clinical data of CMT patients with different disease durations. Pedigree of the CMT2 family. (B) DNA sequence chromatograms showing the heterozygous c.806G > T mutation in TFG present in II‐3, III‐2, and IV‐1 but not in III‐1. (C) Photographs of the proband (III‐2), a 35‐year‐old woman with a disease duration of 11 years. (D) Photographs of the proband's daughter (IV‐1), a 12‐year‐old girl whose disease has not yet appeared. (E) MRIs of III‐2 demonstrate widespread muscle atrophy and fat infiltration into the thighs (milder degree in the sartorius, rectus femoris, and tensor fascia lata and gluteus maximus, iliopsoas, and vastus lateralis; severe in gastrocnemius and soleus muscles) (arrowhead). (F) MRIs of IV‐1 depict normal muscle volume in the thighs. (G‐H) Coronal MRI images of lower limbs of III‐2 and IV‐1.

Spectrum of TFG mutations in human and characterization of Tfg. Linear map of the reported disease‐related mutations in TFG protein. (B) Conservation analysis of the substituted amino acid at 265,269 and 285 in TFG peptides. (C) Multiple‐sequence alignment of the TFG protein sequence in human, mouse, and zebrafish. (D) In situ hybridization histochemistry staining of coronal sections from adult mouse motor cortex and spinal cord. Tfg mRNA was labeled with specific probe (green) and neurons were labeled with NeuN antibody (red), nuclei were labeled with DAPI (blue). Scale bars: 200 μm, 100 μm, or 50 μm. (E) Immunofluorescence staining of primary cultured neurons at day‐8 in culture. The neurites were labeled with MAP2 (green) and the nucleus with DAPI (blue). White arrowhead shows TFG expression in the proximal dendrites of neurons. Scale bars: 50 μm. (F) qRT‐PCR for six embryo development stages (6, 24, 72, 96, 120 and 144 hpf) of wild‐type zebrafish embryos. Hpf, hours postfertilization. (G) Hybridization in situ of tfg in the whole zebrafish embryos at 24, 48 and 72 hpf. The arrow indicates the positive signal in the brain and eye region; the asterisk shows the positive signal in the spinal cord and notochord; the arrowhead shows the positive staining in the pectoral fin anlage.

EXPRESSION / LABELING:
Gene:
Fish:
Anatomical Terms:
Stage Range: Shield to Day 6

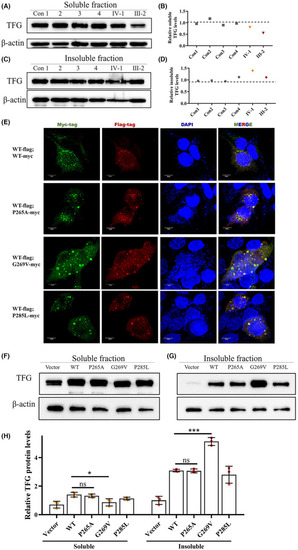
p.G269V TFG mutation induces reduced functional TFG expression level by forming insoluble cytosolic aggregates. (A and B) Western blot for soluble TFG extracted from PBMCs of four healthy controls and the two mutation carriers. Actin was used as the loading control. (C and D) Western blot for insoluble TFG extracted from PBMCs of four healthy controls and two mutation carriers. Actin was used as the loading control. (E) Immunofluorescence staining of HEK293T cells co‐transfected with plasmids encoding FLAG‐tagged wild‐type TFG (Red) and Myc‐tagged wild‐type TFG, Myc‐tagged p.P265A, Myc‐tagged p.G269V, and Myc‐tagged p.P285L TFG mutants (Green). Cell nuclei were labeled with DAPI (blue). Scale bar, 10 μm. (F) Representative western blot analysis of TFG expression in HEK293T cells transfected with plasmids expressing wild‐type TFG, p.P265A, p.G269V, and p.P285L TFG mutants; empty vector was used to represent endogenous TFG as a control. β‐actin was used as the loading control. (G) Quantification of F, mean ± SD; two‐tailed unpaired t‐test; ns, nonsignificant; **p  < 0.01; ***p < 0.001; ****p < 0.0001; n =  3.

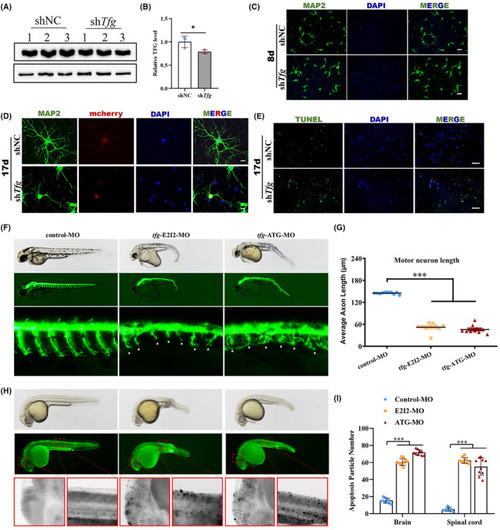
TFG deficiency impairs neurite outgrowth and causes neuronal apoptosis. (A and B) The efficiency of the small interfering RNA (siRNA) to suppress endogenous TFG expression was demonstrated by western blot. (mean ± SD; two‐tailed unpaired t‐test,
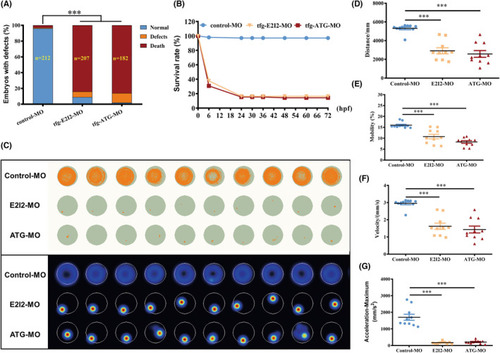
 *p  < 0.05; n =  3). (C) Immunofluorescence staining of primary cultured neurons on day 8 after Tfg knockdown. Neurites were labeled with MAP2 (green), and the nucleus with DAPI (blue). Scale bars: 50 μm. (D) Immunofluorescence staining of primary cultured neurons on day 17 after Tfg knockdown. Neurons were transduced with lentivirus with mCherry (red), neurites were labeled with MAP2 (green) and the nucleus was labeled with DAPI (blue). Scale bars: 20 μm. (E) TUNEL staining of control and Tfg knocked‐down neurons on day 17 in culture. (F) Gross morphology of zebrafish (hb9:eGFP) embryos at 2 dpf. Blue dotted lines show the curved body axis in both groups of tfg morphants. Dpf, days postfertilization. (G) Quantification of the average motor axon length. (mean ± SEM; ANOVA, ***p < 0.0001; n = 10). (H) Acridine orange staining of zebrafish at 32 hpf. Apoptotic cells are visible as bright green spots or black spots. The red dotted box shows the brain and spinal cord region of zebrafish. The boxed regions are shown at higher magnification on the bottom. (I) Quantification of apoptosis particle number in the brain and spinal cord (mean ± SEM; ANOVA, ***p < 0.0001; n = 10).

Locomotor capacity is reduced in tfg morphants. (A) Percentages of embryos with developmental defects in control versus tfg morphants at 3 dpf. (B) A time‐course plot of percent survival in control versus tfg morphants for 3 days. (C) Digital tracks and heatmap image in larvae from control‐MO‐ and tfg‐MO‐injected groups at 5 dpf. (D–G) Statistical analyses of the average total movement distance, mobility, velocity, and maximum acceleration in the tfg‐MO and control groups (mean ± SEM; ANOVA; ***p < 0.0001; n = 10). dpf, days postfertilization.

PHENOTYPE:
Fish:
Knockdown Reagents:
Observed In:
Stage Range: Shield to Protruding-mouth

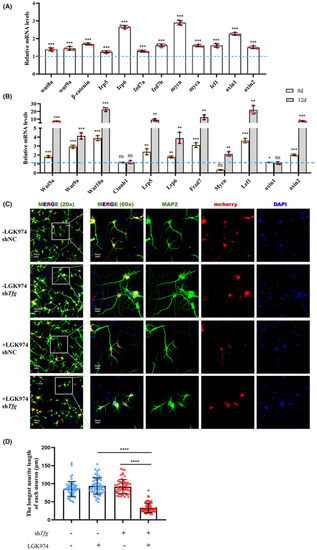
Wnt signaling is activated in response to TFG deficiency. (A) qRT‐PCR‐based validation of the key molecule in Wnt signaling in tfg morphants and control morphants at 3 dpf. (mean ± SD; two‐tailed unpaired t‐test, ***p < 0.001; n =  3). (B) qRT‐PCR‐based validation of the key molecule in Wnt signaling in primary cultured neurons on day 8 and 12 in culture after Tfg knockdown. (mean ± SD; two‐tailed unpaired t‐test; ns, nonsignificant; **p < 0.01; ***p < 0.001; n = 3). (C) Immunofluorescence staining of primary cultured neurons on day 8 after Tfg knockdown and pretreated with LGK974 for 24 h on day 4. Neurites were labeled with MAP2 (green) and the nucleus with DAPI (blue). Scale bars: 20 μm. (D) Quantification of the longest neurite length on day 8 in culture (mean ± SD; two‐tailed unpaired t‐test; ns, nonsignificant; ****p < .0001; n = 60).

EXPRESSION / LABELING:
Genes:
Fish:
Knockdown Reagents:
Anatomical Term:
Stage: Protruding-mouth
PHENOTYPE:
Fish:
Knockdown Reagents:
Observed In:
Stage: Protruding-mouth
Acknowledgments
This image is the copyrighted work of the attributed author or publisher, and ZFIN has permission only to display this image to its users. Additional permissions should be obtained from the applicable author or publisher of the image. Full text @ CNS Neurosci Ther