
IMAGE
FIGURE 5
- ID
- ZDB-IMAGE-221105-5
- Publication
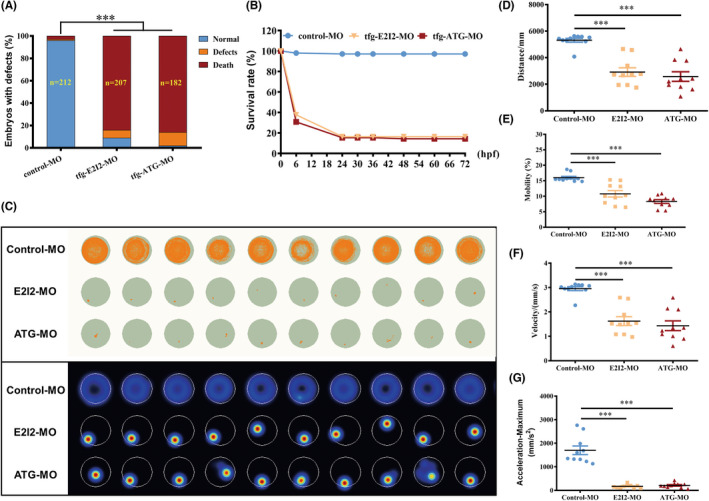
- Chen et al., 2022 - TFG mutation induces haploinsufficiency and drives axonal Charcot-Marie-Tooth disease by causing neurite degeneration
- All Figures
- Figures for Chen et al., 2022
Image
|
Figure Caption
FIGURE 5
Locomotor capacity is reduced in
Figure Data
Acknowledgments
This image is the copyrighted work of the attributed author or publisher, and
ZFIN has permission only to display this image to its users.
Additional permissions should be obtained from the applicable author or publisher of the image.
Full text @ CNS Neurosci Ther