IMAGE

FIGURE 1

ID
ZDB-IMAGE-221105-17
Source
Figures for Chen et al., 2022
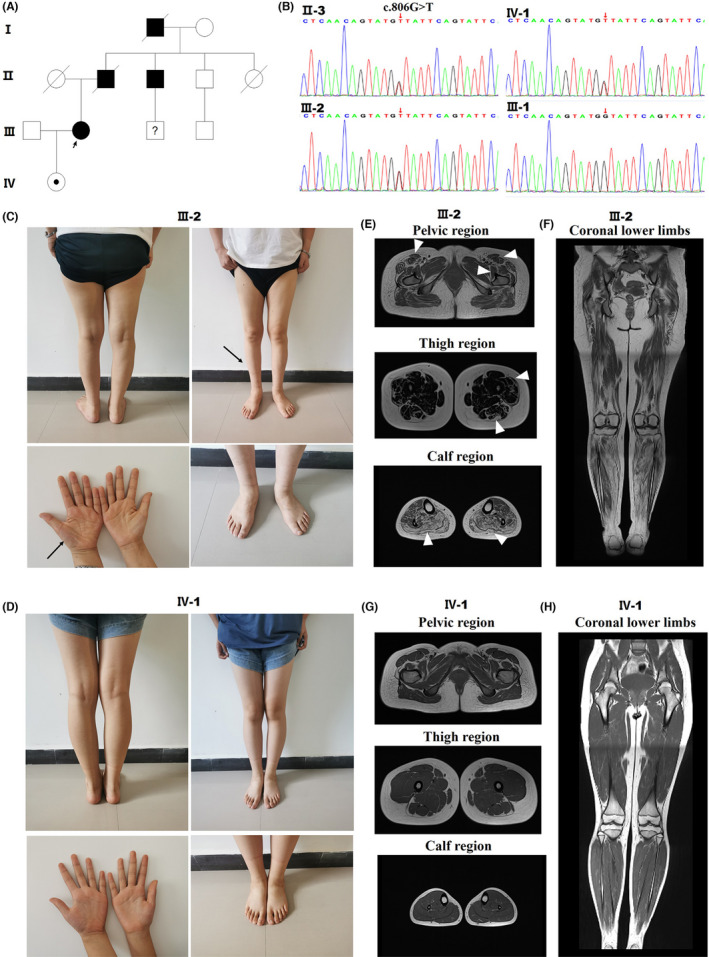
Image
Figure Caption

FIGURE 1

Detection of TFG p. G269V in a CMT2 family and clinical data of CMT patients with different disease durations. Pedigree of the CMT2 family. (B) DNA sequence chromatograms showing the heterozygous c.806G > T mutation in TFG present in II‐3, III‐2, and IV‐1 but not in III‐1. (C) Photographs of the proband (III‐2), a 35‐year‐old woman with a disease duration of 11 years. (D) Photographs of the proband's daughter (IV‐1), a 12‐year‐old girl whose disease has not yet appeared. (E) MRIs of III‐2 demonstrate widespread muscle atrophy and fat infiltration into the thighs (milder degree in the sartorius, rectus femoris, and tensor fascia lata and gluteus maximus, iliopsoas, and vastus lateralis; severe in gastrocnemius and soleus muscles) (arrowhead). (F) MRIs of IV‐1 depict normal muscle volume in the thighs. (G‐H) Coronal MRI images of lower limbs of III‐2 and IV‐1.

Acknowledgments
This image is the copyrighted work of the attributed author or publisher, and ZFIN has permission only to display this image to its users. Additional permissions should be obtained from the applicable author or publisher of the image. Full text @ CNS Neurosci Ther