
- Title
-
Essential Role of RIG-I in Hematopoietic Precursor Emergence in Primitive Hematopoiesis during Zebrafish Development
- Authors
- Wang, Y.Y., Nie, L., Xu, X.X., Shao, T., Fan, D.D., Lin, A.F., Xiang, L.X., Shao, J.Z.
- Source
- Full text @ Immunohorizons
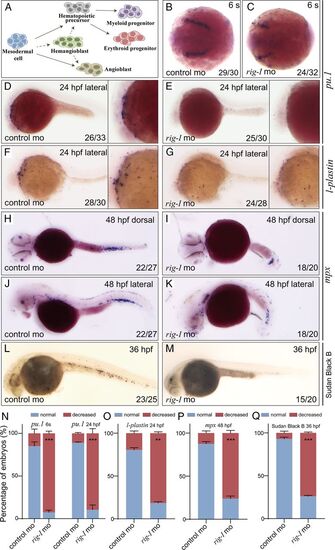
Effect of rig-I knockdown on the expression of myeloid-lineage and granulocyte marker genes (A) General overview of primitive hematopoietic wave during zebrafish embryonic development. (B−E) Expression of myeloid precursor marker pu.1/spi1 in control MO (B and D) or rig-I morphant (C and E) embryos at the six-somite (dorsal view) stage and 24 hpf (24 h, lateral view). Anterior regions of 24-hpf embryos are shown in lateral view at higher magnification in the right panel. (F and G) Expression of macrophage marker lcp1/l-plastin in control MO (F) or rig-I morphant (G) embryos at 24 hpf (24 h, lateral view). (H−K) Expression of granulocyte marker mpx in embryos injected with control MO from lateral view (H) and dorsal view (J) or rig-I morphant embryos from lateral view (I) and dorsal view (K) at 48 hpf. Anterior regions of 48-hpf embryos injected with rig-I MO are shown in lateral and dorsal views at higher magnification in the right panel. (L and M) Detection of granules in granulocytes staining with SBB in control MO (L) or rig-I morphant (M) embryos at 36 hpf. (N−Q) Percent of embryos with phenotype of normal or decreased staining intensity in control or rig-I morphant embryos from (B)–(M) based on WISH analysis or SBB staining. The number of embryos used for statistics is shown in each figure. Images were captured under Olympus stereoscope (MVX10 MacroView; original magnification ×50). Each experiment was repeated three times (n = 3, mean ± SD, Student t test, **p < 0.01, ***p < 0.001). EXPRESSION / LABELING:
PHENOTYPE:
|

Effect of rig-I knockdown on the expression of erythroid-lineage and hematopoietic-precursor marker genes (A−F) Expression of erythroid-lineage marker gata-1 in control MO (A–C) or rig-I morphant (D–F) embryos at the 16-, 20-, and 24-somite stages. (G and H) Detection of hemoglobin in RBCs stained with o-dianisidine in control MO (G) or rig-I morphant (H) embryos at 36 hpf. (I and J) Percent of embryos with phenotype of normal or decreased staining intensity in control or rig-I morphant embryos from (A)–(H) based on WISH analysis. The number of embryos used for statistics is shown in each figure. Each experiment was repeated three times (n = 3). (K−P) The expression of hematopoietic-precursor marker scl/tal1 at the six-somite stage in embryos injected with control MO from dorsal view (K and L) and lateral view (M) or rig-I MO from dorsal view (N and O) and lateral view (P). (Q−V) The expression of hematopoietic-precursor marker lmo2 at the six-somite stage in embryos injected with control MO from dorsal view (Q and R) and lateral view (S) or rig-I MO from dorsal view (T and U) and lateral view (V). (W and X) Percent of embryos with phenotype of normal or decreased staining intensity in control or rig-I morphant embryos from (K)–(V) based on WISH analysis. The number of embryos used for statistics is shown in each figure. Images were captured under Olympus stereoscope (MVX10 MacroView; original magnification ×50) or differential interference contrast microscopy (Carl Zeiss Axiovert 40 CFL, original magnification ×50). Each experiment was repeated three times (n = 3). (Y) Quantitative PCR analysis for the expression of scl/tal1 and lmo2 at the six-somite stage in control MO or rig-I morphant embryos. (Z) Quantitative PCR analysis for the expression of gata-1 and pu.1/spi1 at 24 hpf in control MO or rig-I morphant embryos. Each experiment was repeated three times (n = 3, mean ± SD, Student t test, *p < 0.05, **p < 0.01, ***p < 0.001). EXPRESSION / LABELING:
PHENOTYPE:
|
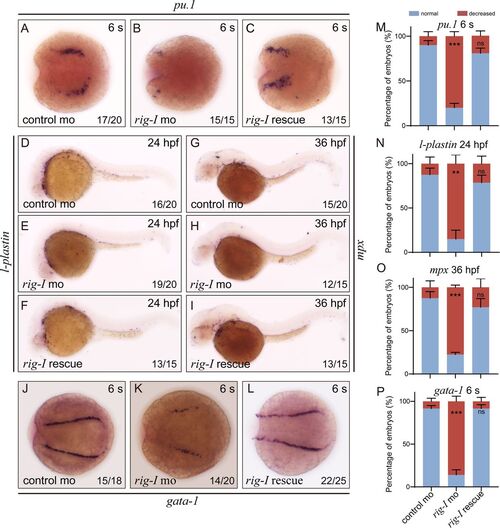
Effect of rig-I mRNA overexpression on primitive erythropoiesis and myelopoiesis (A−C) Expression of pu.1/spi1 at the six-somite stage in control MO (A)–, rig-I MO (B)–, or rig-I MO and mRNA (C)–injected embryos from posterodorsal view with anterior to the top. (D−F) Expression of lcp1/l-plastin at 24 hpf in control MO (D)–, rig-I MO (E)–, or rig-I MO and mRNA (F)–injected embryos from lateral view. (G−I) Expression of mpx at 36 hpf in control MO (G)–, rig-I MO (H)–, or rig-I MO and mRNA (I)–injected embryos from lateral view. (J−L) Expression of gata-1 at the six-somite stage in control MO (J)–, rig-I MO (K)–, or rig-I MO and mRNA (L)–injected embryos from posterodorsal view with posterior to the top. Images were captured under Olympus stereoscope (MVX10 MacroView; original magnification ×50). (M−P) Percent of embryos with phenotype of normal or decreased staining intensity in control or rig-I morphant embryos from (A)–(L) based on WISH analysis. The number of embryos used for statistics is shown in each figure. Each experiment was repeated three times (n = 3, mean ± SD, Student t test, **p < 0.01, ***p < 0.001; ns, not significant). EXPRESSION / LABELING:
PHENOTYPE:
|
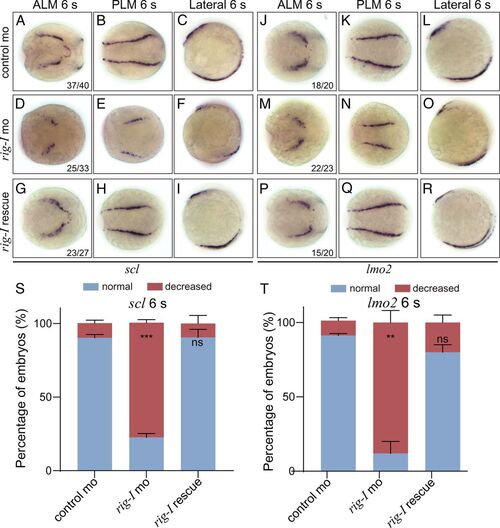
Effect of rig-I mRNA overexpression on the generation of hematopoietic precursors (A−I) Expression of hematopoietic precursor marker scl/tal1 at the six-somite stage in embryos injected with control MO from dorsal view (A and B) and lateral view (C), rig-I MO from dorsal view (D and E) and lateral view (F), or rig-I MO and mRNA from dorsal view (G and H) and lateral view (I). (J−R) Expression of hematopoietic precursor marker scl/tal1 at the six-somite stage in embryos injected with control MO from dorsal view (J and K) and lateral view (L), rig-I MO from dorsal view (M and N) and lateral view (O), or rig-I MO and mRNA from dorsal view (P and Q) and lateral view (R). Images were captured under Olympus stereoscope (MVX10 MacroView; original magnification ×50). (S and T) Percent of embryos with phenotype of normal or decreased staining intensity in control or rig-I morphant embryos from (A)–(R) based on WISH analysis. The number of embryos used for statistics is shown in each figure. Each experiment was repeated three times (n = 3, mean ± SD, Student t test, **p < 0.01, ***p < 0.001; ns, not significant). EXPRESSION / LABELING:
PHENOTYPE:
|
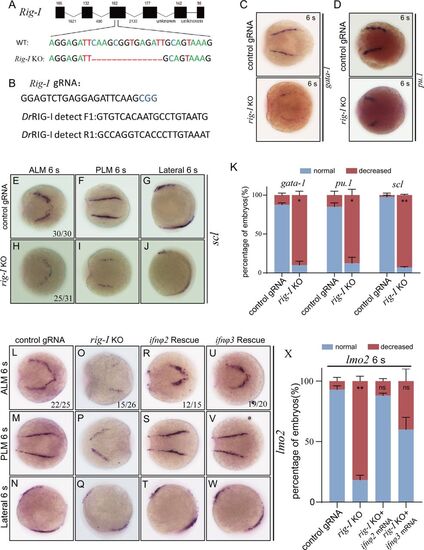
Detection of rig-I knockout in embryos and effect of rig-I knockout on the expression of hematopoietic precursor markers (A) Sequence of the third exon of rig-I showing target sites of gRNA, leading to the deletion of 14 bp. (B) Rig-I–gRNA sequence and primers used to detect CRISPR-Cas9–based rig-I knockout. (C–J) Expression of erythroid lineage marker gata-1, myeloid lineage marker pu.1/spi1, hematopoietic precursor marker scl/tal1, at the six-somite stage in rig-I−/− embryos, as detected by WISH. (K) Percent of embryos with phenotype of normal or decreased staining intensity in control or rig-I−/− embryos from (C)–(J) based on WISH analysis. (L–W) Expression of lmo2 at the six-somite stage in control embryos from dorsal view (L and M) and lateral view (N), rig-I−/− embryos from dorsal view (O and P) and lateral view (Q), and rig-I−/− embryos with ifnφ2 mRNA from dorsal view (R and S) and lateral view (T), or rig-I−/− embryos with ifnφ3 mRNA from dorsal view (U and V) and lateral view (W). (X) Percent of embryos with phenotype of normal or decreased staining intensity in control or rig-I morphant embryos from (L)–(W) based on WISH analysis. The number of embryos used in the experiment is shown in the figures. Images were captured under Olympus stereoscope (MVX10 MacroView; original magnification ×50). Each experiment was repeated three times (n = 3, mean ± SD, Student t test, *p < 0.05, **p < 0.01; ns, not significant). EXPRESSION / LABELING:
PHENOTYPE:
|

Rig-I knockdown has minimal effect on proliferation and apoptosis of hematopoietic cells (A and B) Cell proliferation detected by whole-mount in situ immunohistochemistry using anti-pH3 Ab in 24-hpf embryos injected with control MO (A) or rig-I MO (B). (C and D) Cell apoptosis detected by TUNEL assay in 24-hpf embryos injected with control MO (C) or rig-I MO (D). The boxed areas are enlarged in the corresponding right panels. Images were captured under Olympus stereoscope (MVX10 MacroView; original magnification ×50). (E) Percentage of pH3-positive cells in embryos injected with a control or indicated morpholinos from (A) and (B). (F) Percentage of TUNEL-positive cells in embryos injected with a control or indicated morpholinos from (C) and (D). Each experiment was repeated three times (n = 3, mean ± SD, Student t test). PHENOTYPE:
|
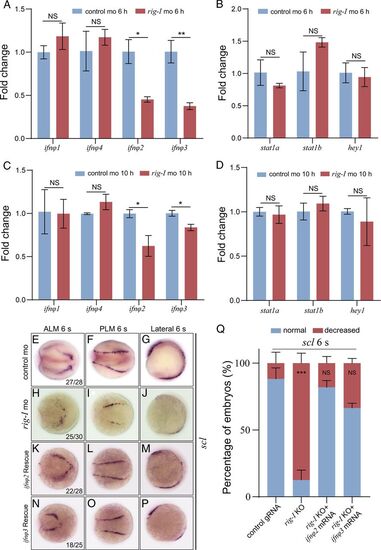
Examination of the involvement of IFN signaling downstream of RIG-I in the emergence of hematopoietic precursors (A and B) Quantitative PCR results of ifnφ1-4 at 6 and 10 hpf in control MO or rig-I morphant embryos. (C and D) Quantitative PCR results of stat1a, stat1b, and hey1 at 6 and 10 hpf in control MO or rig-I morphant embryos. (E−P) Expression of hematopoietic precursor marker scl/tal1 at the six-somite stage in embryos injected with control MO from dorsal view (E and F) and lateral view (G), rig-I MO from dorsal view (H and I) and lateral view (J), or rig-I MO and ifnφ2 mRNA from dorsal view (K and L) and lateral view (M), or ifnφ3 mRNA from dorsal view (N and O) and lateral view (P). Images were captured under Olympus stereoscope (MVX10 MacroView; original magnification ×50). (Q) Percent of embryos with phenotype of normal or decreased staining intensity in control or rig-I morphant embryos from (E)–(M) based on WISH analysis. Overexpression of ifnφ2-3 mRNAs partially rescued the defect of hematopoietic precursors in rig-I morphant. Each experiment was repeated three times (n = 3, mean ± SD, Student t test, *p < 0.05, **p < 0.01, ***p < 0.001). EXPRESSION / LABELING:
PHENOTYPE:
|

RNA-binding–deficient RIG-I mutant is unable to rescue the defect of hematopoietic precursors in rig-I morphants (A) Schematic of various forms of RIG-I, including wild-type and RNA-binding–deficient mutant RIG-Is with amino acid substitutions at F859, K864, and K867 sites in the repressor domain (RD), as indicated by asterisks. (B) A luciferase assay was performed using epithelioma papulosum cyprini cells transfected with the IFNφ3-pro luciferase reporter and TK-Renilla together with 20 ng of RIG-I wild-type or RIG-I mutant (F859A, K864A, K867A), followed by transfection with poly(I:C) (0.1 μg/ml) for another 24 h. (C−K) Expression of hematopoietic precursor marker scl/tal1 at the six-somite stage in embryos injected with control MO from dorsal view (C and D) and lateral view (E), rig-I MO from dorsal view (F and G) and lateral view (H), or rig-I MO and RNA-binding-deficient rig-I mutant mRNA from dorsal view (I and J) and lateral view (K). Images were captured under Olympus stereoscope (MVX10 MacroView; original magnification ×50). (L) Percent of embryos with phenotype of normal or decreased staining intensity in control or rig-I morphant embryos from (B)–(J) based on WISH analysis. The number of embryos used for statistics is shown in each figure. Each experiment was repeated three times (n = 3, mean ± SD, Student t test, ***p < 0.001). EXPRESSION / LABELING:
PHENOTYPE:
|

ZFIN is incorporating published figure images and captions as part of an ongoing project. Figures from some publications have not yet been curated, or are not available for display because of copyright restrictions. EXPRESSION / LABELING:
|