
Fig. 2
- ID
- ZDB-IMAGE-220520-27
- Genes
- Publication
- Wang et al., 2022 - Essential Role of RIG-I in Hematopoietic Precursor Emergence in Primitive Hematopoiesis during Zebrafish Development
- All Figures
- Figures for Wang et al., 2022
|
Fig. 2
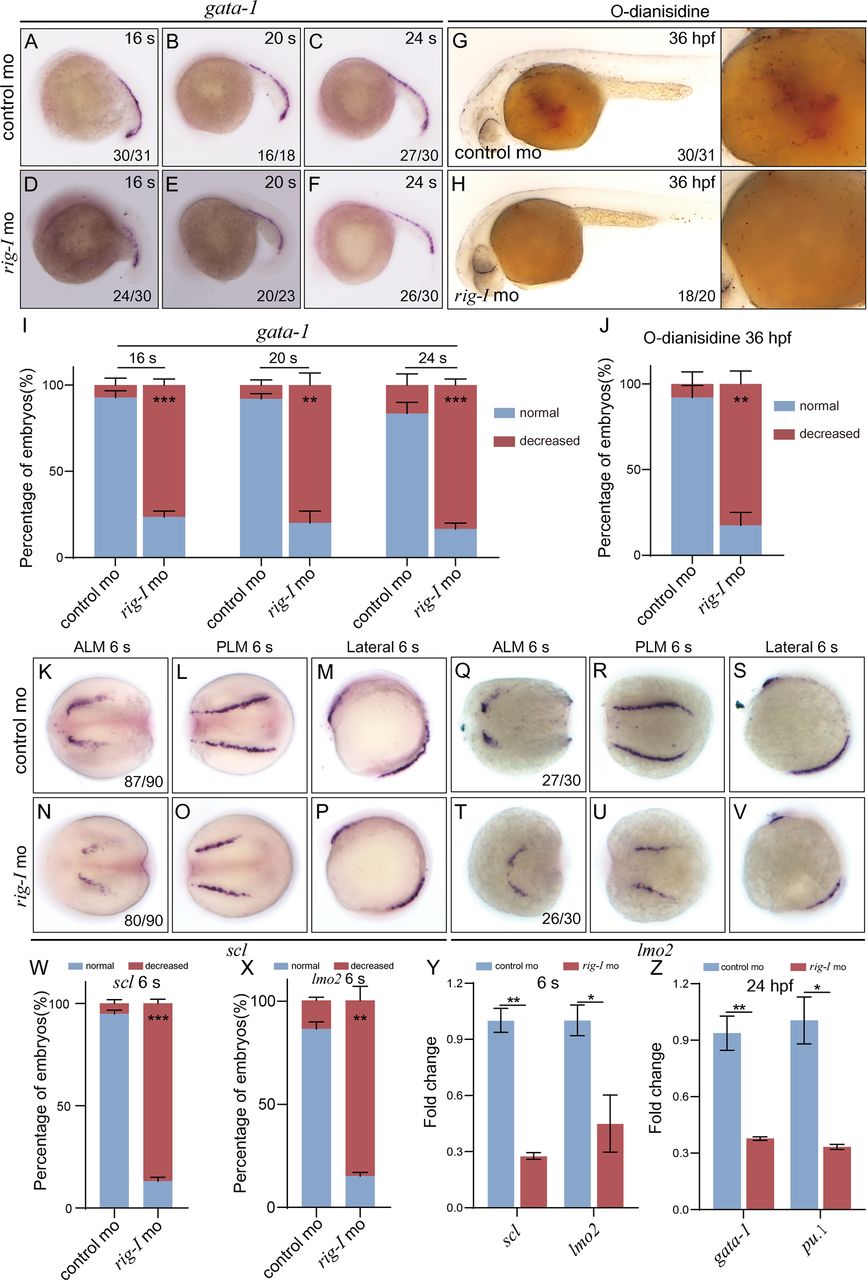
Effect of rig-I knockdown on the expression of erythroid-lineage and hematopoietic-precursor marker genes
(A−F) Expression of erythroid-lineage marker gata-1 in control MO (A–C) or rig-I morphant (D–F) embryos at the 16-, 20-, and 24-somite stages. (G and H) Detection of hemoglobin in RBCs stained with o-dianisidine in control MO (G) or rig-I morphant (H) embryos at 36 hpf. (I and J) Percent of embryos with phenotype of normal or decreased staining intensity in control or rig-I morphant embryos from (A)–(H) based on WISH analysis. The number of embryos used for statistics is shown in each figure. Each experiment was repeated three times (n = 3). (K−P) The expression of hematopoietic-precursor marker scl/tal1 at the six-somite stage in embryos injected with control MO from dorsal view (K and L) and lateral view (M) or rig-I MO from dorsal view (N and O) and lateral view (P). (Q−V) The expression of hematopoietic-precursor marker lmo2 at the six-somite stage in embryos injected with control MO from dorsal view (Q and R) and lateral view (S) or rig-I MO from dorsal view (T and U) and lateral view (V). (W and X) Percent of embryos with phenotype of normal or decreased staining intensity in control or rig-I morphant embryos from (K)–(V) based on WISH analysis. The number of embryos used for statistics is shown in each figure. Images were captured under Olympus stereoscope (MVX10 MacroView; original magnification ×50) or differential interference contrast microscopy (Carl Zeiss Axiovert 40 CFL, original magnification ×50). Each experiment was repeated three times (n = 3). (Y) Quantitative PCR analysis for the expression of scl/tal1 and lmo2 at the six-somite stage in control MO or rig-I morphant embryos. (Z) Quantitative PCR analysis for the expression of gata-1 and pu.1/spi1 at 24 hpf in control MO or rig-I morphant embryos. Each experiment was repeated three times (n = 3, mean ± SD, Student t test, *p < 0.05, **p < 0.01, ***p < 0.001).