
- Title
-
Sensing of mycobacterial arabinogalactan by galectin-9 exacerbates mycobacterial infection
- Authors
- Wu, X., Wu, Y., Zheng, R., Tang, F., Qin, L., Lai, D., Zhang, L., Chen, L., Yan, B., Yang, H., Wang, Y., Li, F., Zhang, J., Wang, F., Wang, L., Cao, Y., Ma, M., Liu, Z., Chen, J., Huang, X., Wang, J., Jin, R., Wang, P., Sun, Q., Sha, W., Lyu, L., Moura-Alves, P., Dorhoi, A., Pei, G., Zhang, P., Chen, J., Gao, S., Randow, F., Zeng, G., Chen, C., Ye, X.S., Kaufmann, S.H.E., Liu, H., Ge, B.
- Source
- Full text @ EMBO Rep.
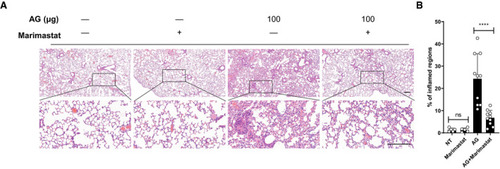
C57BL/6 mice were left untreated (NT) or were intraperitoneally treated with indicated amounts of AG for 3 days in the absence or presence of the MMP inhibitor marimastat (10 mg/kg) given intraperitoneally prior to AG stimulation. Lung sections stained with H&E (A) and quantification of lung lesion burden from H&E‐stained sections (B). Data information: Data in (A) are representative of |
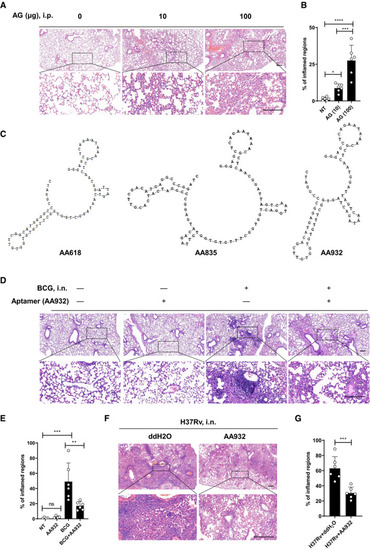
C57BL/6 mice were left untreated (NT) or were intraperitoneally treated with indicated amounts of AG for 3 days. Lung sections stained with hematoxylin and eosin(H&E) (A) and quantification of lung lesion burden from H&E‐stained sections (B). Sequence and secondary structure of identified aptamers against AG as predicted with DNAMAN version 6.0. H&E staining of lung sections from mice 4 weeks after intranasal infection with Data information: Data in (B, E, G) are means ± SD of indicated numbers of mice from 1 of |
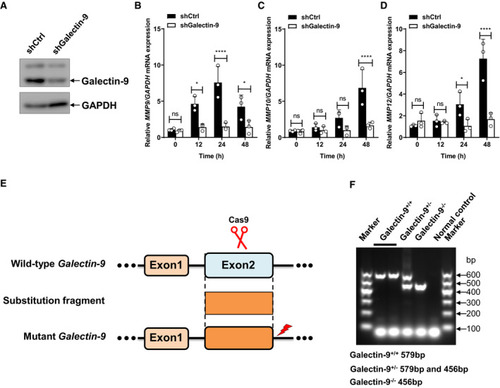
Immunoblots of cell lysates of THP‐1 cells stably transfected with scrambled shRNA or shRNA targeting galectin‐9. qPCR analysis of Diagram showing the gRNA‐targeting genome sites. Identification of galectin‐9 KO mice with PCR. Data information: Data in (B–D) are means ± SD averaged from |
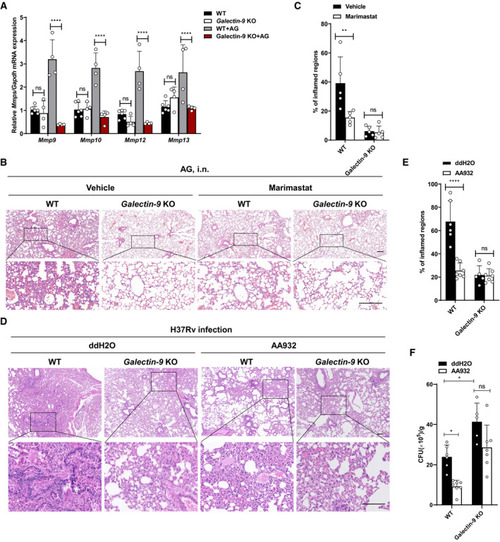
qPCR analysis of WT or WT or CFU quantification of the bacterial titers of lung tissue homogenates from WT or Data information: Data in (B and D) are representative of |

ZFIN is incorporating published figure images and captions as part of an ongoing project. Figures from some publications have not yet been curated, or are not available for display because of copyright restrictions. PHENOTYPE:
|
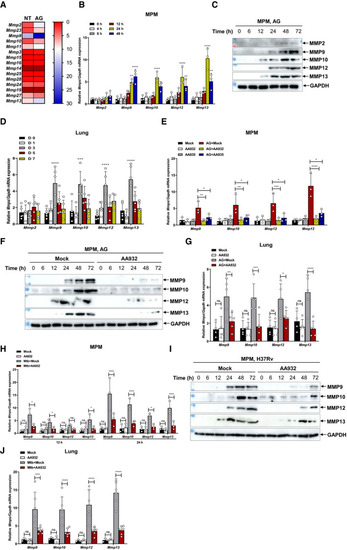
Heat map showing RPKM (Reads Per Kilobase per million of mapped reads) mean values of Quantitative polymerase chain reaction (qPCR) analysis of Immunoblots of cell supernatants to analyze secreted MMP2, MMP9, MMP10, MMP12, and MMP13 by mouse peritoneal macrophages stimulated with AG (1 μg/ml) for indicated times; GADPH of cell lysates served as a loading control. qPCR analysis of qPCR analysis of Immunoblots of cell supernatants to analyze secreted MMP9, MMP10, MMP12, and MMP13 by mouse peritoneal macrophages stimulated with AG (1 μg/ml) for indicated times in the absence or presence of AG aptamers (0.5 μg/ml); GADPH of cell lysates served as the loading control. qPCR analysis of qPCR analysis of Immunoblots of cell supernatants to analyze secreted MMP9, MMP10, MMP12, and MMP13 by mouse peritoneal macrophages infected with H37Rv for indicated times (MOI = 5) in the absence or presence of AG aptamers (0.5 μg/ml); GADPH of cell lysates served as the loading control. qPCR analysis of Data information: Data in (B, E, H) are means ± SD averaged from 3 independent experiments performed with technical triplicates and each symbol represents the mean of technical triplicates. Data in (D, G, J) are means ± SD of indicated numbers of mice from 1 of at least |
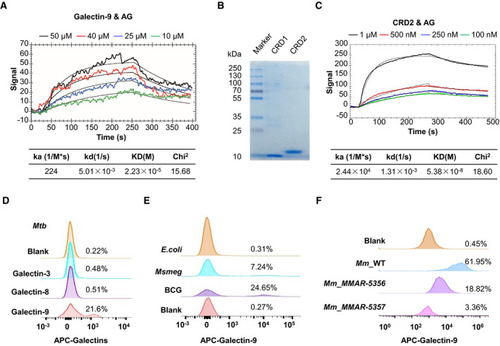
Surface plasmon resonance (SPR) assay of the direct interaction of AG with galectin‐9. Curve fittings to a 1:1 Langmuir‐binding model calculated with TraceDrawer are shown as smooth black lines. Coomassie blue‐stained SDS–PAGE of carbohydrate recognition domain CRD1 and CRD2 of galectin‐9. Data are representative of SPR assay of the interaction of AG with CRD2 of galectin‐9. Curve fittings to a 1:1 Langmuir‐binding model calculated with TraceDrawer are shown as smooth black lines. FACS assay showing interactions of FACS assay of interactions of galectin‐9 with mycobacteria including FACS assay of interactions of galectin‐9 with wild‐type |
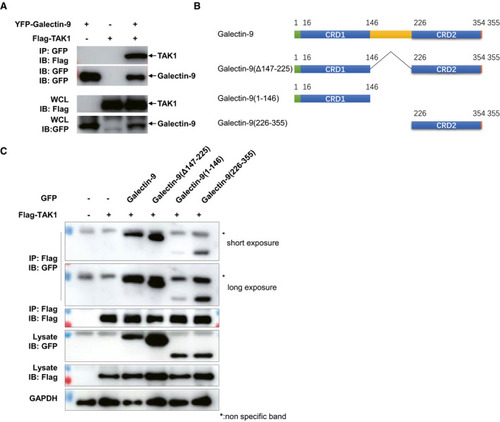
Immunoblots and immunoprecipitation analysis of lysates of HEK293T cells transfected with various plasmids as indicated. Diagram showing various constructs of plasmids including Galectin-9, Galectin-9(Δ147–225), Galectin-9(1–146), and Galectin-9(226–355). Immunoblots and immunoprecipitation of lysates from HEK293T cells transfected with plasmids as indicated. |
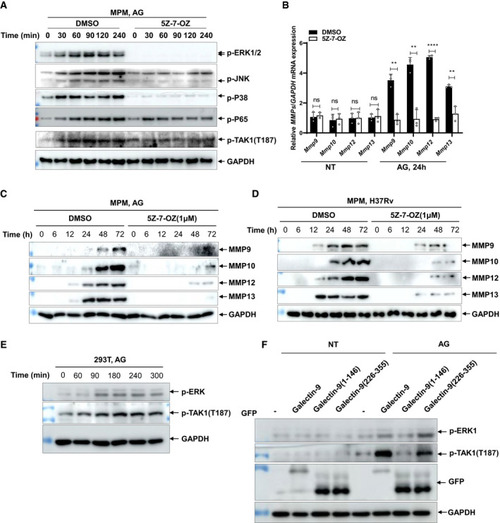
Immunoblots of cell lysates of peritoneal macrophages stimulated with AG (1 μg/ml) in the absence or presence of TAK1 inhibitor 5Z‐7‐OZ (1 μM) for indicated times. Data are representative of qPCR analysis of Immunoblots of cell supernatants to analyze secreted MMP9, MMP10, MMP12, and MMP13 by mouse peritoneal macrophages stimulated with AG (1 μg/ml) for indicated times in the absence or presence of TAK1 inhibitor 5Z‐7‐OZ (1 μM); GADPH of cell lysates served as the loading control. Immunoblots of cell supernatants to analyze secreted MMP9, MMP10, MMP12, and MMP13 by mouse peritoneal macrophages infected with H37Rv for indicated times (MOI = 5) in the absence or presence of TAK1 inhibitor 5Z‐7‐OZ (1 μM); GADPH of cell lysates served as the loading control. Immunoblots of cell lysates of HEK293T cells stimulated with AG (1 μg/ml) for the indicated time to analyze p‐ERK1/2 and p‐TAK1(T187). GADPH of cell lysates is shown as loading control. Immunoblots of lysates of HEK293T cells stimulated with AG (1 μg/ml) for 3 h after transfection of the indicated plasmids for 48 h. Data information: Data in (B) are means ± SD averaged from 3 independent experiments performed with technical triplicates and each symbol represents the mean of technical triplicates. Two‐way ANOVA followed by Dunnett's |
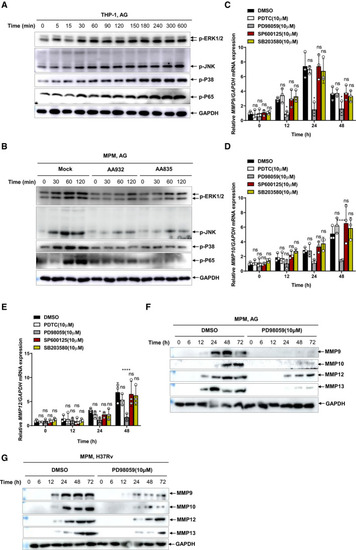
Immunoblots of cell lysates were performed to analyze p‐ERK1/2, p‐JNK, p‐P38, and p‐P65 by THP‐1 cells stimulated with AG (1 μg/ml) for indicated times, and GADPH as a loading control. Immunoblots of cell lysates were performed to analyze p‐ERK1/2, p‐JNK, p‐P38, and p‐P65 by mouse peritoneal macrophages stimulated with AG (1 μg/ml) for indicated times left untreated or pretreated with AG aptamer (1 μg/ml), and GADPH as a loading control. qPCR analysis of Immunoblots of cell supernatants to analyze secreted MMP9, MMP10, MMP12, and MMP13 by mouse peritoneal macrophages stimulated with AG (1 μg/ml) for indicated times in the absence or presence of inhibitor targeting ERK (PD98059) at the concentration of 10 μM; GADPH of cell lysates served as the loading control. Immunoblots of cell supernatants to analyze secreted MMP9, MMP10, MMP12, and MMP13 by mouse peritoneal macrophages infected with H37Rv for indicated times (MOI = 5) in the absence or presence of inhibitor targeting ERK (PD98059) at the concentration of 10 μM; GADPH of cell lysates served as the loading control. Data information: Data in (A and B) are representative of |
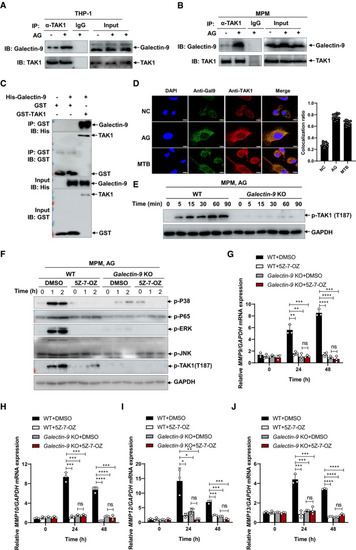
Immunoblots and immunoprecipitation of cell lysates to analyze endogenous interaction of galectin‐9 with TAK1 by human THP‐1 cells (A) or mouse peritoneal macrophages (B) left unstimulated or stimulated with AG (1 μg/ml) for 1 h. Confocal microscopy of mouse peritoneal macrophages left untreated (NC) (upper row) or stimulated with AG (1 μg/ml) for 2 h (middle row) or infected with H37Rv for 3 h (MOI = 5) (bottom row), staining with anti‐Galectin‐9 and anti‐TAK1 antibody. DAPI, nuclei, blue. Scale bar, 5 μm. Data in the right graph show mean ± SD of Immunoblots of cell lysates to analyze phosphorylated TAK1 by mouse peritoneal macrophages isolated from WT or Immunoblots of cell lysates of peritoneal macrophages isolated from WT or qPCR analysis of Data information: Data in (G to J) are means ± SD averaged from 3 independent experiments performed with technical triplicates, and each symbol represents the mean of technical triplicates. Two‐way ANOVA followed by Dunnett's |
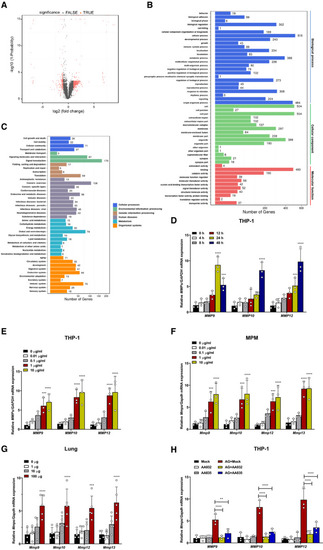
Scatter plots of differentially expressed genes in the mouse peritoneal macrophages stimulated with AG (1 μg/ml) for 24 h as identified by RNA‐seq analysis. The RNA from the peritoneal macrophages was pooled and subjected to RNA‐seq. GO class of gene expressions in mouse peritoneal macrophages stimulated with AG (1 μg/ml) for 24 h as identified by RNA‐seq analysis. KEGG class of gene expressions in mouse peritoneal macrophages stimulated with AG (1 μg/ml) for 24 h as identified by RNA‐seq analysis. qPCR analysis of qPCR analysis of qPCR analysis of qPCR analysis of Data information: Data in (D–F, H) are means ± SD averaged from 3 independent experiments performed with technical triplicates, and each symbol represents the mean of technical triplicates. Data in (G) are means ± SD of indicated mice from 1 of |
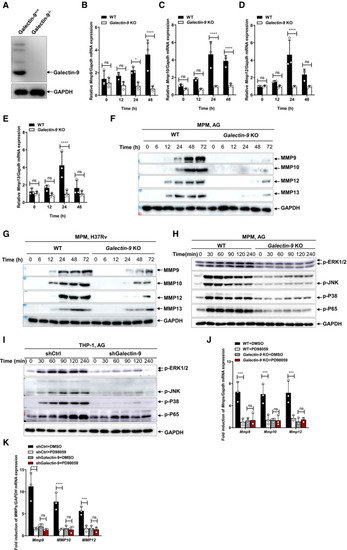
Immunoblots of cell lysates were performed to analyze galectin‐9 by mouse peritoneal macrophages isolated from WT or qPCR analysis of Immunoblots of cell supernatants to analyze secreted MMP9, MMP10, MMP12, and MMP13 by mouse peritoneal macrophages isolated from WT or Immunoblots of cell supernatants to analyze secreted MMP9, MMP10, MMP12, and MMP13 by mouse peritoneal macrophages isolated from WT or Immunoblot of lysates of peritoneal macrophages isolated from wild‐type and Immunoblot of lysates of shCtrl and shGalectin‐9 THP‐1 cells stimulated with AG (1 μg/ml) for indicated times. Data are representative of qRT–PCR detection of qRT–PCR detection of Data information: Data in (B to E, J, and K) are means ± SD averaged from 3 independent experiments performed with technical triplicates and each symbol represents the mean of technical triplicates. Two‐way ANOVA followed by Dunnett's |
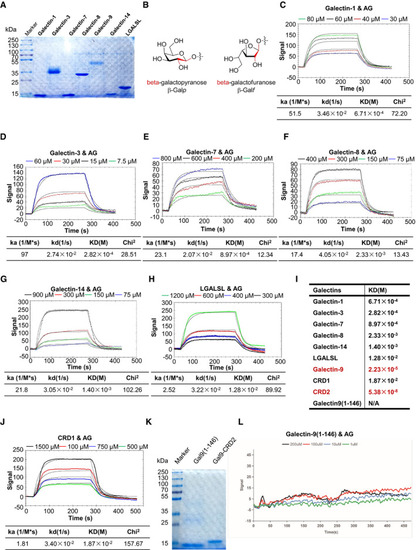
Coomassie blue staining of galectin‐1, galectin‐3, galectin‐7, galectin‐8, galectin‐9, galectin‐14, and galectin‐related protein (LGALSL) post–SDS–PAGE analysis. Chemical structures and conformations of β‐galactofuranoside and β‐galactopyranoside. SPR assay of interactions of AG with indicated galectins including galectin‐1 (C), galectin‐3 (D), galectin‐7 (E), galectin‐8 (F), galectin‐14 (G), LGASL (H), and a summary table of KD (I). Curve fittings to a 1:1 Langmuir‐binding model calculated with TraceDrawer are shown as smooth black lines. The binding affinity of galectin‐9 and CRD2 to AG is highlighted in (I) in red. SPR assay of interactions of AG with CRD1 of galectin‐9. Coomassie blue staining of galectin‐9(1–146) and CRD2 of galectin‐9 post–SDS–PAGE analysis. SPR assay of interactions of AG with galectin‐9(1–146). |