
|
H
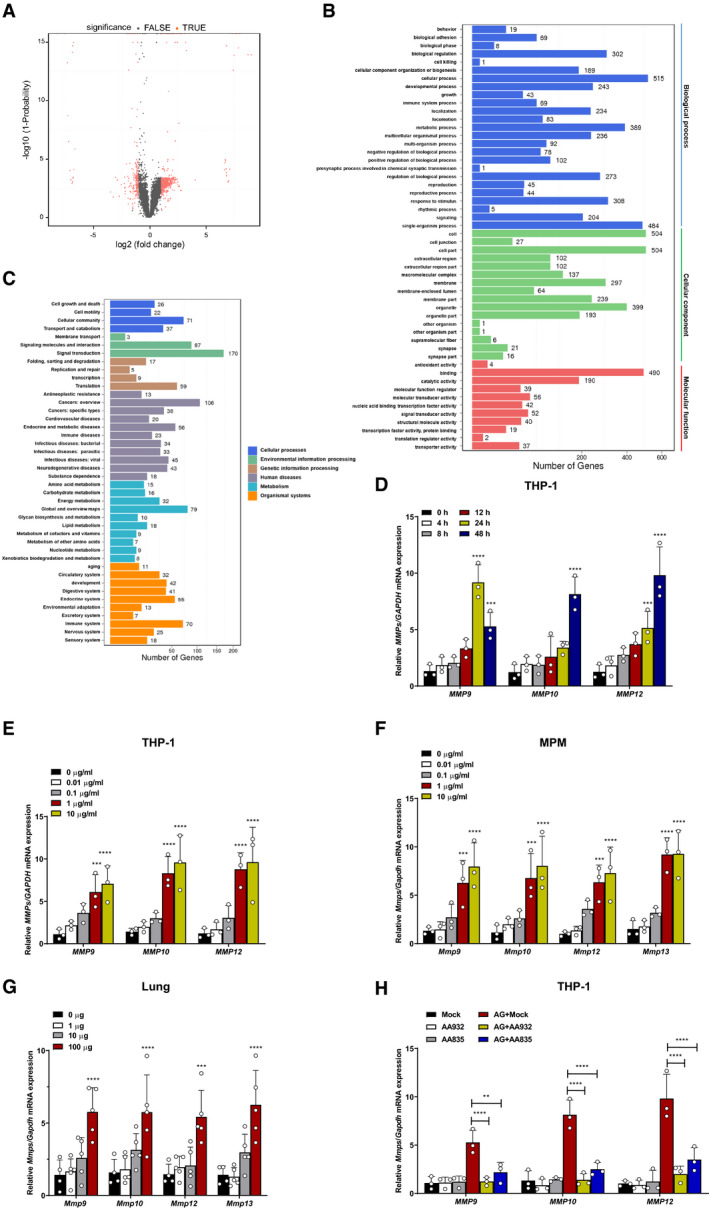
Scatter plots of differentially expressed genes in the mouse peritoneal macrophages stimulated with AG (1 μg/ml) for 24 h as identified by RNA‐seq analysis. The RNA from the peritoneal macrophages was pooled and subjected to RNA‐seq. GO class of gene expressions in mouse peritoneal macrophages stimulated with AG (1 μg/ml) for 24 h as identified by RNA‐seq analysis. KEGG class of gene expressions in mouse peritoneal macrophages stimulated with AG (1 μg/ml) for 24 h as identified by RNA‐seq analysis. qPCR analysis of qPCR analysis of qPCR analysis of qPCR analysis of
Data information: Data in (D–F, H) are means ± SD averaged from 3 independent experiments performed with technical triplicates, and each symbol represents the mean of technical triplicates. Data in (G) are means ± SD of indicated mice from 1 of