FIGURE

K

ID
ZDB-FIG-220131-584
Publication
Wu et al., 2021 - Sensing of mycobacterial arabinogalactan by galectin-9 exacerbates mycobacterial infection
Other Figures
All Figure Page
Back to All Figure Page
K

Galectin‐9 is essential for AG‐induced production of MMPs

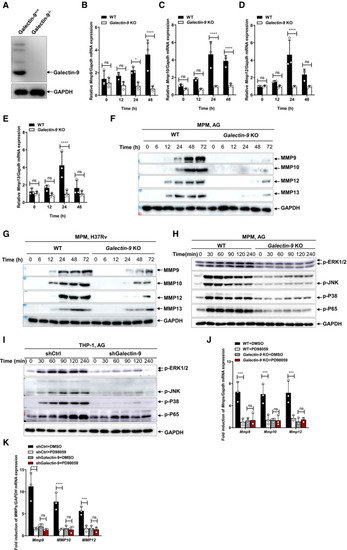
Immunoblots of cell lysates were performed to analyze galectin‐9 by mouse peritoneal macrophages isolated from WT or Galectin‐9 KO mice, and GADPH as a loading control.

qPCR analysis of Mmps including Mmp9 (B), Mmp10 (C), Mmp12 (D), and Mmp13 (E) from mouse peritoneal macrophages isolated from either wild‐type or Galectin‐9 KO mice stimulated with AG (1 μg/ml) for 24 h.

Immunoblots of cell supernatants to analyze secreted MMP9, MMP10, MMP12, and MMP13 by mouse peritoneal macrophages isolated from WT or Galectin‐9 KO mice stimulated with AG (1 μg/ml) for indicated times; GADPH of cell lysates served as the loading control.

Immunoblots of cell supernatants to analyze secreted MMP9, MMP10, MMP12, and MMP13 by mouse peritoneal macrophages isolated from WT or Galectin‐9 KO mice infected with H37Rv for indicated times (MOI = 5); GADPH of cell lysates served as the loading control.

Immunoblot of lysates of peritoneal macrophages isolated from wild‐type and Galectin‐9 KO mice stimulated with AG (1 μg/ml) for indicated times. Data are representative of n = 3 independent experiments.

Immunoblot of lysates of shCtrl and shGalectin‐9 THP‐1 cells stimulated with AG (1 μg/ml) for indicated times. Data are representative of n = 3 independent experiments.

qRT–PCR detection of Mmp transcripts including Mmp9, Mmp10, and Mmp12 in wild‐type and Galectin‐9 KO peritoneal macrophages stimulated with AG (1 μg/ml) for 24 h in the absence or presence of ERK inhibitor PD98059 (10 μM).

qRT–PCR detection of MMP transcripts including Mmp9, Mmp10, and Mmp12 in shCtrl and shGalectin‐9 THP‐1 cells stimulated with AG (1 μg/ml) for 24 h in the absence or presence of ERK inhibitor PD98059 (10 μM).

Data information: Data in (B to E, J, and K) are means ± SD averaged from 3 independent experiments performed with technical triplicates and each symbol represents the mean of technical triplicates. Two‐way ANOVA followed by Dunnett's post hoc test were used for statistical analysis. ns, not significant; *P < 0.05; ***P < 0.001 ****P < 0.0001.

Source data are available online for this figure.

Expression Data

Expression Detail
Antibody Labeling
Phenotype Data

Phenotype Detail
Acknowledgments
This image is the copyrighted work of the attributed author or publisher, and ZFIN has permission only to display this image to its users. Additional permissions should be obtained from the applicable author or publisher of the image. Full text @ EMBO Rep.