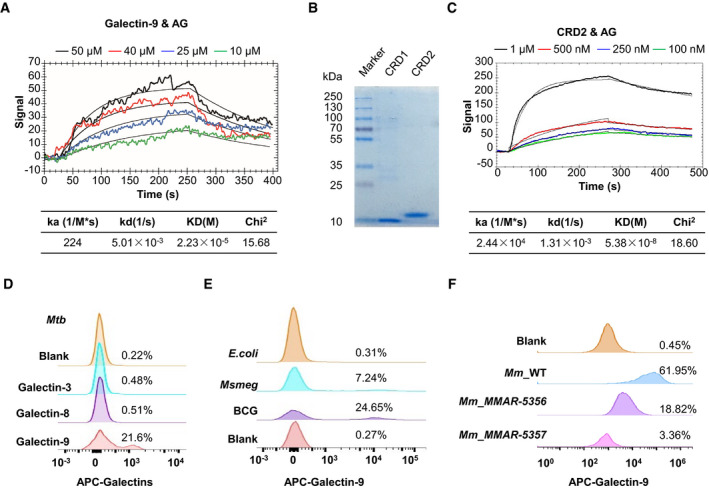
IMAGE

Figure 5

ID
ZDB-IMAGE-220131-572
Source
Figures for Wu et al., 2021
Image
Figure Caption

Figure 5 AG interacts with galectin‐9

Surface plasmon resonance (SPR) assay of the direct interaction of AG with galectin‐9. Curve fittings to a 1:1 Langmuir‐binding model calculated with TraceDrawer are shown as smooth black lines.

Coomassie blue‐stained SDS–PAGE of carbohydrate recognition domain CRD1 and CRD2 of galectin‐9. Data are representative of n = 3 independent experiments.

SPR assay of the interaction of AG with CRD2 of galectin‐9. Curve fittings to a 1:1 Langmuir‐binding model calculated with TraceDrawer are shown as smooth black lines.

FACS assay showing interactions of Mtb H37Rv with different galectins including galectin‐3, galectin‐8, and galectin‐9. The blank control was H37Rv staining with APC‐anti‐rabbit antibody alone.

FACS assay of interactions of galectin‐9 with mycobacteria including M. bovis BCG and M. smegmatis mc2155 as well as E. coli. The blank control was BCG staining with APC‐anti‐rabbit antibody alone. Data shown are representative of n = 3 independent experiments.

FACS assay of interactions of galectin‐9 with wild‐type M. marinum (Mm_WT) and MMAR‐5356 and MMAR‐5357 mutants of M. marinum treated with Tet. The blank control was Mm_WT staining with APC‐anti‐rabbit antibody alone. Data shown are representative of n = 3 independent experiments.

Acknowledgments
This image is the copyrighted work of the attributed author or publisher, and ZFIN has permission only to display this image to its users. Additional permissions should be obtained from the applicable author or publisher of the image. Full text @ EMBO Rep.