Figure Caption
Figure 2
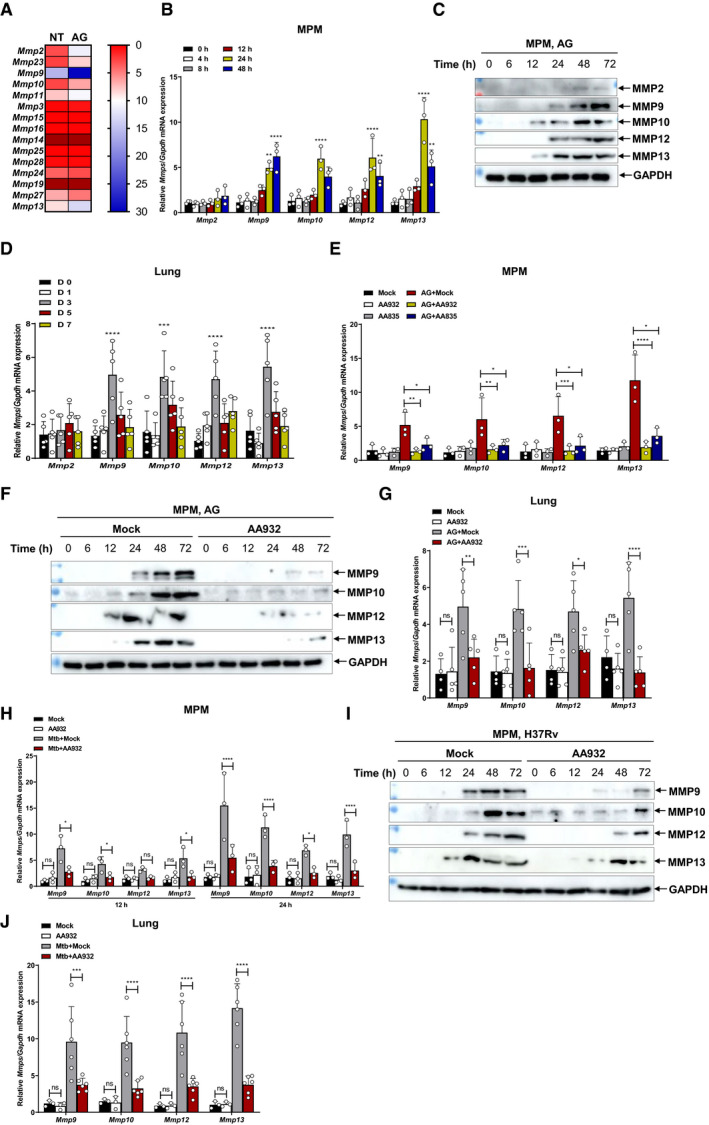
AG induces expression of MMPsHeat map showing RPKM (Reads Per Kilobase per million of mapped reads) mean values of Mmps from mouse peritoneal macrophages (MPM) stimulated with AG (1 μg/ml) for 24 h or left untreated (NT).
Quantitative polymerase chain reaction (qPCR) analysis of Mmps including Mmp2, Mmp9, Mmp10, Mmp12, and Mmp13 mRNA from mouse peritoneal macrophages stimulated with AG (1 μg/ml) for indicated times.
Immunoblots of cell supernatants to analyze secreted MMP2, MMP9, MMP10, MMP12, and MMP13 by mouse peritoneal macrophages stimulated with AG (1 μg/ml) for indicated times; GADPH of cell lysates served as a loading control.
qPCR analysis of Mmps including Mmp2, Mmp9, Mmp10, Mmp12, and Mmp13 from the lungs of mice at indicated days post‐intraperitoneal administration of AG (100 μg).
qPCR analysis of Mmps including Mmp9, Mmp10, Mmp12, and Mmp13 from mouse peritoneal macrophages stimulated with AG (1 μg/ml) for 24 h in the absence or presence of AG aptamers (0.5 μg/ml).
Immunoblots of cell supernatants to analyze secreted MMP9, MMP10, MMP12, and MMP13 by mouse peritoneal macrophages stimulated with AG (1 μg/ml) for indicated times in the absence or presence of AG aptamers (0.5 μg/ml); GADPH of cell lysates served as the loading control.
qPCR analysis of Mmps including Mmp9, Mmp10, Mmp12, and Mmp13 from the lungs of mice at 3 days post‐intraperitoneal administration of AG (100 μg) in the absence or presence of AG aptamers. AG aptamers (1 μg/mouse) were intranasally administrated per day.
qPCR analysis of Mmps including Mmp9, Mmp10, Mmp12, and Mmp13 from mouse peritoneal macrophages infected with H37Rv for 24 h (MOI = 5) in the absence or presence of AG aptamers (1 μg/ml).
Immunoblots of cell supernatants to analyze secreted MMP9, MMP10, MMP12, and MMP13 by mouse peritoneal macrophages infected with H37Rv for indicated times (MOI = 5) in the absence or presence of AG aptamers (0.5 μg/ml); GADPH of cell lysates served as the loading control.
qPCR analysis of Mmps including Mmp9, Mmp10, Mmp12, and Mmp13 from lungs of mice intranasally infected with H37Rv (2 × 10⁶ cfu/mouse) for 4 weeks in the absence or presence of AG aptamers. AG aptamers (1 μg/mouse) were intranasally administrated once at a 1‐week interval.
Data information: Data in (B, E, H) are means ± SD averaged from 3 independent experiments performed with technical triplicates and each symbol represents the mean of technical triplicates. Data in (D, G, J) are means ± SD of indicated numbers of mice from 1 of at least n = 2 independent experiments, and each symbol represents data from 1 mouse. Data (D, G, J) shown are representative of n = 2 (D) or n = 3 (G, J) independent experiments. Two‐way ANOVA followed by Tukey's post hoc test (B, D, E, G, H, J) was used for statistical analysis. *P < 0.05; **P < 0.01; ***P < 0.001; ****P < 0.0001.
Source data are available online for this figure.
Acknowledgments
This image is the copyrighted work of the attributed author or publisher, and
ZFIN has permission only to display this image to its users.
Additional permissions should be obtained from the applicable author or publisher of the image.
Full text @ EMBO Rep.