FIGURE

G–J

ID
ZDB-FIG-220131-586
Publication
Wu et al., 2021 - Sensing of mycobacterial arabinogalactan by galectin-9 exacerbates mycobacterial infection
Other Figures
All Figure Page
Back to All Figure Page
G–J

Galectin‐9 mediates TAK1 recruitment to induce production of MMPs

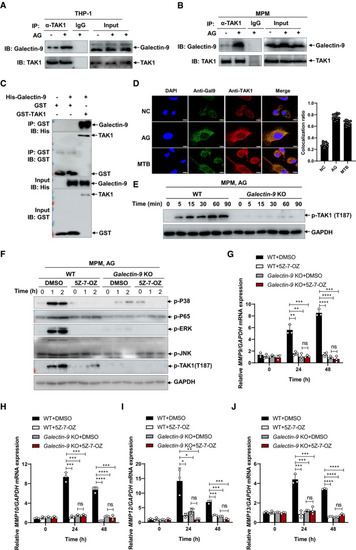
Immunoblots and immunoprecipitation of cell lysates to analyze endogenous interaction of galectin‐9 with TAK1 by human THP‐1 cells (A) or mouse peritoneal macrophages (B) left unstimulated or stimulated with AG (1 μg/ml) for 1 h.

In vitro glutathione S‐transferase (GST) precipitation assay purified histidine (His)‐tagged Galectin‐9 (+) with GST alone or GST‐tagged TAK1.

Confocal microscopy of mouse peritoneal macrophages left untreated (NC) (upper row) or stimulated with AG (1 μg/ml) for 2 h (middle row) or infected with H37Rv for 3 h (MOI = 5) (bottom row), staining with anti‐Galectin‐9 and anti‐TAK1 antibody. DAPI, nuclei, blue. Scale bar, 5 μm. Data in the right graph show mean ± SD of n = 12 fields from three independent experiments. The symbols indicate the colocalization ratio of at least 10 cells in each field.

Immunoblots of cell lysates to analyze phosphorylated TAK1 by mouse peritoneal macrophages isolated from WT or Galectin‐9 KO mice stimulated with AG (1 μg/ml) for indicated times; GADPH of cell lysates served as the loading control. Data are representative of at least n = 3 independent experiments.

Immunoblots of cell lysates of peritoneal macrophages isolated from WT or Galectin‐9 KO mice stimulated with AG (1 μg/ml) in the absence or presence of TAK1 inhibitor 5Z‐7‐OZ (1 μM) for indicated times. Data are representative of n = 3 independent experiments.

qPCR analysis of Mmps including Mmp9 (G), Mmp10 (H), Mmp12 (I), and Mmp13 (J) from WT or Galectin‐9 KO mouse peritoneal macrophages stimulated with AG (1 μg/ml) for 24 h in the absence or presence of TAK1 inhibitor 5Z‐7‐OZ (1 μM).

Data information: Data in (G to J) are means ± SD averaged from 3 independent experiments performed with technical triplicates, and each symbol represents the mean of technical triplicates. Two‐way ANOVA followed by Dunnett's post hoc test were used for statistical analysis. ns, not significant; *P < 0.05; **P < 0.01; ***P < 0.001 ****P < 0.0001.

Source data are available online for this figure.

Expression Data

Expression Detail
Antibody Labeling
Phenotype Data

Phenotype Detail
Acknowledgments
This image is the copyrighted work of the attributed author or publisher, and ZFIN has permission only to display this image to its users. Additional permissions should be obtained from the applicable author or publisher of the image. Full text @ EMBO Rep.