- Title
-
Genome-wide loss-of-function analysis of deubiquitylating enzymes for zebrafish development
- Authors
- Tse, W.K., Eisenhaber, B., Ho, S.H., Ng, Q., Eisenhaber, F., and Jiang, Y.J.
- Source
- Full text @ BMC Genomics
|
huC and her4 expression in morphants of group I zebrafish DUBs at 24 hpf. huC and her4 expression at 24 hpf, dorsal view. Increase in huC expression was found in morphants of group I DUBs when compared to control (A-D). There are 3 members in this group, which named as otud7b, bap1 and uchl3. The arrows mark the increased huC expression area (B-C), while the arrowheads mark the denser expression pattern (D). uchl3 morphants showed the most severe effect with both stronger and denser huC expression. her4 is a downstream target gene in the Notch signaling pathway, increase of neurons may be due to the decrease of the Notch activation. Decrease in her4 expression was found in morphants of all group I DUBs when compared to control (E): otud7b (F), bap1 (G) and uchl3 (H). Arrows show the absence of her4 expression in the morphants. The number of embryos with the presented phenotype is shown in the right bottom corner of each panel. |
|
Comparison of huC expression in morphants of groups II, III and IV zebrafish DUBs at 24 hpf. huC expression at 24 hpf, dorsal view. Decreased huC expression was found in morphants of these 3 groups. Group II has 16 members that showed a typical decreased huC expression (arrows). Group III has 13 members that showed the decreased huC expression with destructive patterning. Lastly, group IV has 4 members that had the most severe decreased and destructive huC expression. All 4 members named otud4, usp5, usp15 and usp25 could not form a normal neuronal pattern in the head region. Arrowheads mark the abnormal patterns in morphants of group III; while arrows indicate the absence of neurons in morphants of group IV. EXPRESSION / LABELING:
|
|
Comparison of ventral (bmp4, eve1, gata2) and dorsal (chd, gsc) markers expression in morphants of group IV zebrafish DUBs at 50-60% epiboly. Ventral markers (bmp4, eve1 and gata2) and dorsal markers (chd and gsc) expression of group IV morphants at 50-60% epiboly stage, animal pole views, dorsal towards the right. otud4 (B, G, L, Q, V), usp5 (C, H, M, R, W) and usp25 (E, J, O, T, Y) morphants showed narrower expression pattern for ventral markers (A-O) but wider expression pattern of dorsal markers (P-Y). usp15 showed a similar expression pattern (D, I, N, S, X) with control (A, F, K, P, U). Red dot lines indicate the normal expression margin of ventral markers in wild-type embryos. EXPRESSION / LABELING:
|
|
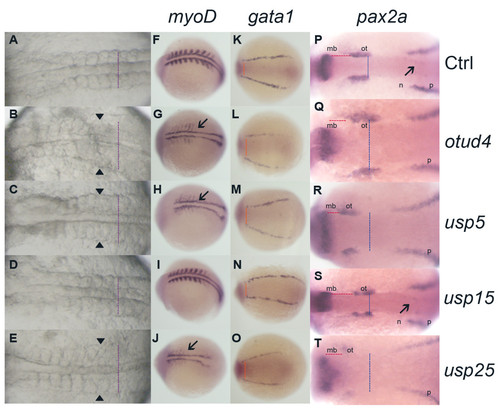
Comparison of myoD, gata1 and pax2a expression in morphants of group IV zebrafish DUBs at 10-somite stage. Morphology of group IV morphants at 10-somite stage (A-E). Lateral expansion of somite muscles were indicated (arrowheads and purple dot lines) in otud4 (B), usp5 (C) and usp25 (E) morphants. usp15 (D) morphants showed a similar phenotype as control (A). myoD, gata1 and pax2a expression at 10-somite stage, dorsal view (F-T). Orange dot lines represent the distance between two lateral stripes; blue dot lines indicate the distance between two optic vesicles; while red dot lines show the distance between midbrain and otic vesicle. mb, midbrain; ot, otic vesicle; n, neuronal and p, pronephric precursor expression domains. otud4, usp5 and usp25 morphants showed features of dorsalization: lateral expression of myoD (G-J, marked with arrows), pax2a (Q-T) and widening of the gata1 (L-O) mesoderm distance expression. usp15 (I, N, S) showed a similar expression to control (F, K, P). All are head to the left. EXPRESSION / LABELING:
|
|
RT-PCR of group IV zebrafish DUB genes in their corresponding morphants and huC and/or her4 expression in group I and selected group II morphants |
|
Phenotype of dorsalized (C1-C5) and ventralized (V1-V4) embryos at 24-30 hpf |
|
Lateral view of ventral markers (bmp4, eve1, gata2) expression in morphants of group IV zebrafish DUBs at 50-60% epiboly |
|
In situ hybridization results of selected genes at different stages of embryonic development after overexpression and knockdown experiment |


