FIGURE

Fig. S7

ID
ZDB-FIG-100128-7
Publication
Tse et al., 2009 - Genome-wide loss-of-function analysis of deubiquitylating enzymes for zebrafish development
Other Figures
All Figure Page
Back to All Figure Page
Fig. S7

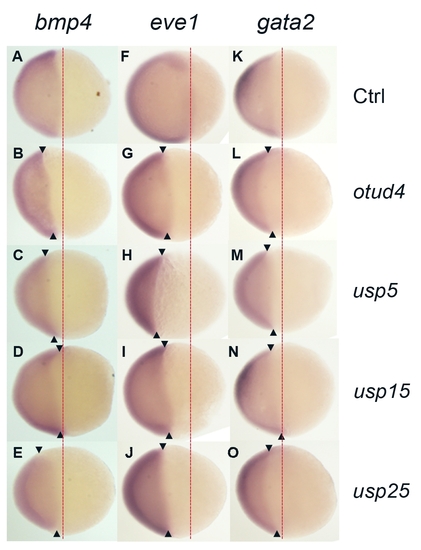
Lateral view of ventral markers (bmp4, eve1, gata2) expression in morphants of group IV zebrafish DUBs at 50-60% epiboly
In addition to the animal pole view shown in Figure 3, expression of ventral markers (bmp4, eve1 and gata2) at 50-60% epiboly stage was also shown in lateral views, animal pole towards the left. otud4 (B, G, L), usp5 (C, H, M) and usp25 (E, J, O) morphants showed narrower expression pattern for ventral markers (A-O). usp15 showed similar expression pattern (D, I, N) with control (A, F, K). Red dot lines indicated the normal expression margin of ventral markers in wild-type embryos.

Expression Data

Expression Detail
Antibody Labeling
Phenotype Data

Phenotype Detail
Acknowledgments
This image is the copyrighted work of the attributed author or publisher, and ZFIN has permission only to display this image to its users. Additional permissions should be obtained from the applicable author or publisher of the image. Full text @ BMC Genomics