
Fig. 4
- ID
- ZDB-IMAGE-100128-4
- Genes
- Publication
- Tse et al., 2009 - Genome-wide loss-of-function analysis of deubiquitylating enzymes for zebrafish development
- All Figures
- Figures for Tse et al., 2009
|
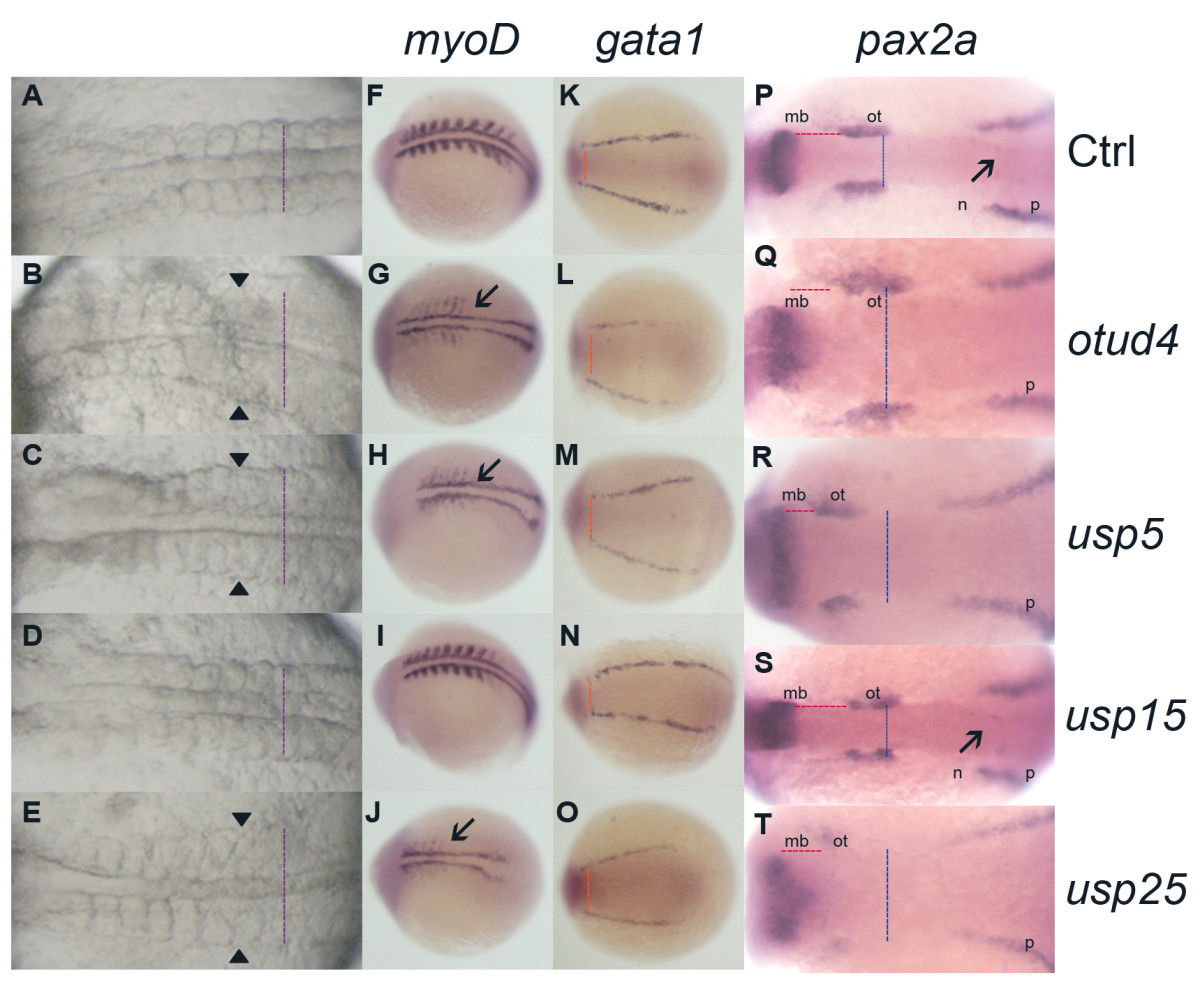
Fig. 4 Comparison of myoD, gata1 and pax2a expression in morphants of group IV zebrafish DUBs at 10-somite stage. Morphology of group IV morphants at 10-somite stage (A-E). Lateral expansion of somite muscles were indicated (arrowheads and purple dot lines) in otud4 (B), usp5 (C) and usp25 (E) morphants. usp15 (D) morphants showed a similar phenotype as control (A). myoD, gata1 and pax2a expression at 10-somite stage, dorsal view (F-T). Orange dot lines represent the distance between two lateral stripes; blue dot lines indicate the distance between two optic vesicles; while red dot lines show the distance between midbrain and otic vesicle. mb, midbrain; ot, otic vesicle; n, neuronal and p, pronephric precursor expression domains. otud4, usp5 and usp25 morphants showed features of dorsalization: lateral expression of myoD (G-J, marked with arrows), pax2a (Q-T) and widening of the gata1 (L-O) mesoderm distance expression. usp15 (I, N, S) showed a similar expression to control (F, K, P). All are head to the left.