
Fig. S7
- ID
- ZDB-IMAGE-100128-7
- Publication
- Tse et al., 2009 - Genome-wide loss-of-function analysis of deubiquitylating enzymes for zebrafish development
- All Figures
- Figures for Tse et al., 2009
|
Fig. S7
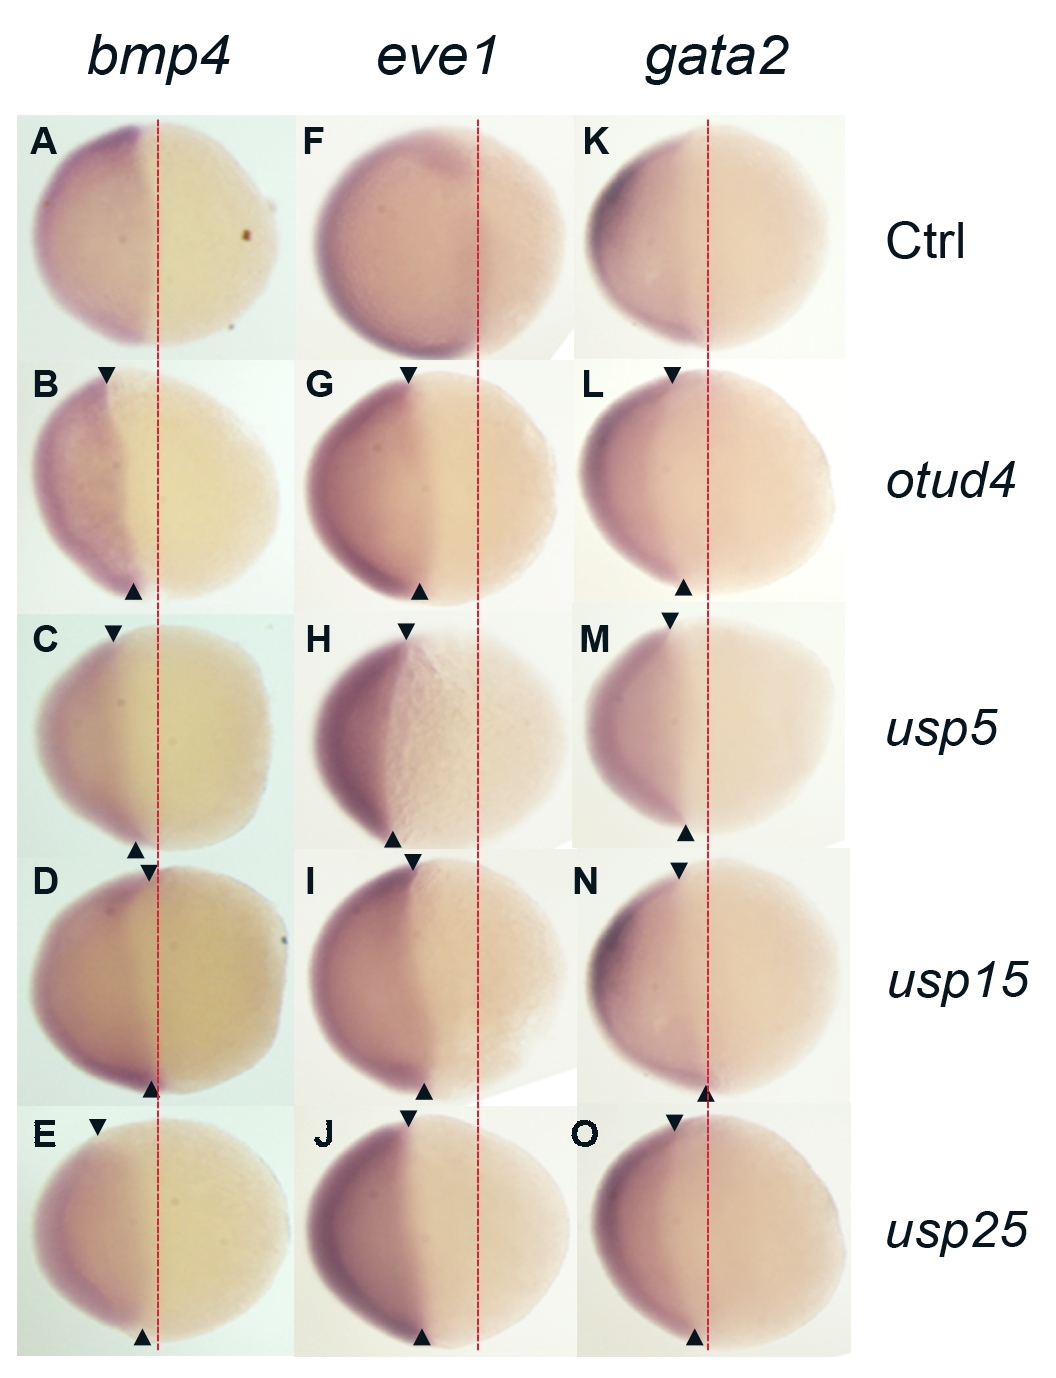
Lateral view of ventral markers (bmp4, eve1, gata2) expression in morphants of group IV zebrafish DUBs at 50-60% epiboly
In addition to the animal pole view shown in Figure 3, expression of ventral markers (bmp4, eve1 and gata2) at 50-60% epiboly stage was also shown in lateral views, animal pole towards the left. otud4 (B, G, L), usp5 (C, H, M) and usp25 (E, J, O) morphants showed narrower expression pattern for ventral markers (A-O). usp15 showed similar expression pattern (D, I, N) with control (A, F, K). Red dot lines indicated the normal expression margin of ventral markers in wild-type embryos.