
- Title
-
Tbx2b is required for the development of the parapineal organ
- Authors
- Snelson, C.D., Santhakumar, K., Halpern, M.E., and Gamse, J.T.
- Source
- Full text @ Development

The left and right habenulae develop more symmetrically in from beyond (fby) mutants. (A-F) Dorsal views of the epithalamus of 4-dpf zebrafish larvae. (A) In wild-type (WT) larvae, the KCTD gene leftover (lov) was expressed in more cells of the left (L) than of the right (R) habenula. (B) In fby mutant larvae, the number of lov-expressing cells in the left habenula was reduced relative to WT. In WT (C,E), the lov-related right on (ron) and dexter (dex) genes were expressed in more cells of the right than of the left habenula, but in fby mutants (D,F), ron and dex habenular expression appeared symmetrical. Brackets indicate the regions where expression was expanded in the mutants. (G-N) Lateral views of the brain of 4-dpf larvae. Diagrams depicting projections from the habenular nuclei (Lh and Rh) via the fasciculi retroflexus (FR) to the interpeduncular nucleus (IPN) in WT (G) and fby mutant (H) larvae at 4 dpf. Red and green areas indicate Lov and Ron immunoreactive neurons, respectively; yellow indicates colocalization of Lov and Ron; gray boxes indicate the area of the brain imaged in I-N. In WT, (I) an antibody against Lov labeled habenular efferents that terminated in both the dorsal and ventral IPN, whereas (J) an antibody against Ron labeled axons terminating in the ventral IPN. (K) Overlay of I and J. In fby mutants, (L) Lov labeling decreased in the dorsal IPN and increased in the ventral IPN, and (M) Ron labeling increased in the ventral IPN. (N) Overlay of L and M. Brackets labeled d and v indicate dorsal and ventral regions of the IPN. Scale bars: 25 μm. EXPRESSION / LABELING:
|
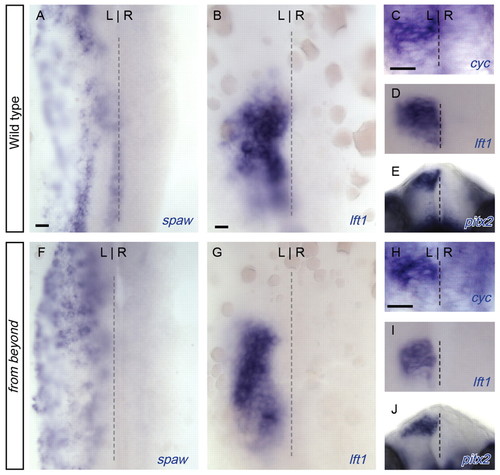
Asymmetric expression of Nodal pathway components is unaffected by the fby mutation. (A,B,F,G) The lateral plate mesoderm and (C-E,H-J) the dorsal diencephalon of 20-hpf zebrafish embryos. All views are dorsal, except for frontal views in E and J. Left-sided expression of the Nodal-related genes southpaw (spaw; A,F) and cyclops (cyc; C,H), the Nodal antagonist lefty1 (lft1; B,D,G,I), and of the downstream Nodal effector pitx2 (E,J) was observed in both WT and fby mutant embryos during somitogenesis. Scale bars: 25 μm. EXPRESSION / LABELING:
|
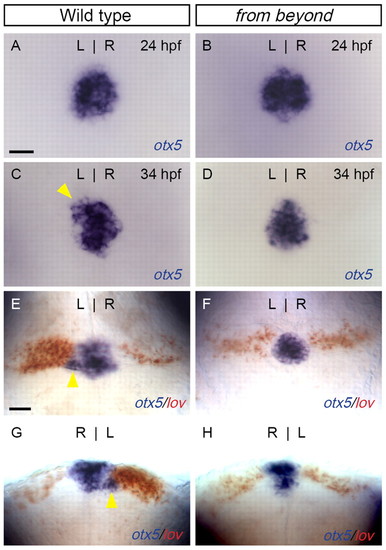
Disruption of parapineal formation in fby mutant zebrafish larvae. (A-F) Dorsal and (G,H) frontal views of the epithalamus of (A,C,E,G) WT and (B,D,F,H) fby mutant larvae. (A,B) At 24 hpf, the pineal complex anlage labeled with otx5 (blue) appeared similar in WT embryos (A) and fby mutants (B). (C,D) However, by 34 hpf, when a parapineal was apparent in WT embryos (C), no parapineal organ developed in fby mutants (D). Arrowhead in C indicates the emerging parapineal organ. (E,G) By 4 dpf, WT larvae had a left-sided parapineal organ (arrowheads) and more cells expressed lov (red) in the left habenula. (F,H) In fby mutant larvae, no left-sided parapineal organ was apparent; rather, otx5-expressing cells were found below the pineal organ. The number of lov-expressing cells in the left habenula was reduced compared with WT. Scale bars: 25 μm. |
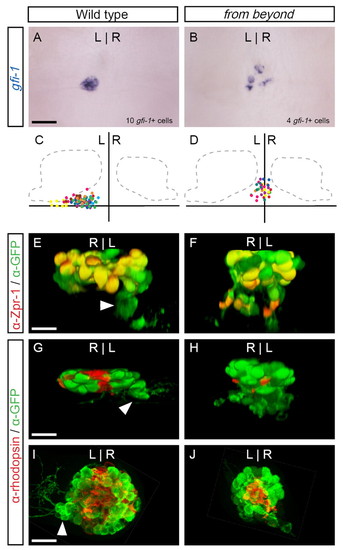
Fewer and misplaced parapineal cells in fby mutants. (A-D,I,J) Dorsal and (E-H) frontal views of 4-dpf zebrafish larvae. (A) In the epithalamus, expression of gfi1 was exclusive to the parapineal cells of WT larvae at 4 dpf, which formed a compact organ. (B) In fby mutants, fewer gfi1-expressing cells developed than in WT, and they were found as individual cells in the middle of the brain. (C,D) The position of gfi1-expressing cells from ten individual WT (C) or fby (D) larvae as represented by different colored dots for each sample. The vertical axis divides the left and right sides of the brain, and the horizontal axis is the posterior border of the habenular nuclei. (E) Double immunofluorescent labeling of a WT larva with foxd3:gfp (green) and the antibody Zpr1 (red). Zpr1 labels red-green double cone cells, which were almost exclusively found in the pineal but not the parapineal (arrowhead). (F) In fby mutants, Zpr1 labeled cells were found throughout the pineal complex, including cells ventral to the pineal organ. (G-J) Double labeling with foxd3:gfp (green) and anti-rhodopsin antibody (red). Rhodopsin-expressing cells were near the dorsal midline of the pineal organ in WT (G,I) and (H,J) fby mutant larvae. Scale bars: 25 μm. |
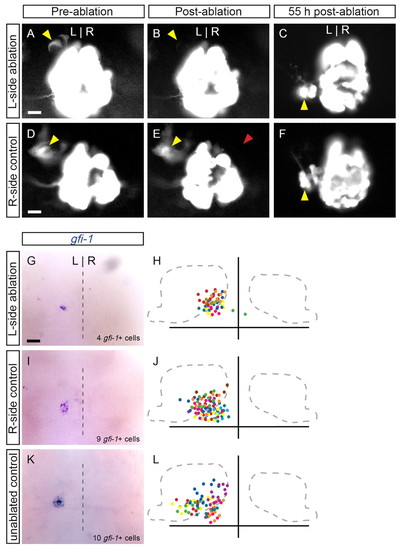
Reduced numbers of parapineal cells are able to migrate to the left side of the brain. Dorsal views of the epithalamus in (A,B,D,E) 31-hpf zebrafish embryos or (C,F,G-L) 55-hpf larvae. Expression of foxd3:gfp labels parapineal precursor cells (A, yellow arrowhead), which are subsequently ablated with laser pulses (B). The remaining parapineal cells (average of 5±2 cells, n=18) migrate to the left side of the brain, as revealed by foxd3:gfp (C) and gfi1 (G) expression. In H, the position of gfi1-expressing cells in ten larvae are overlaid, with different colors representing individual samples. (D-F) As a control, cells contralateral to the parapineal precurors were ablated (red arrowhead). The number of parapineal cells (10±1, n=8) and their migration in these controls (I,J) were identical to those in unablated controls (K,L; 10±2 cells, n=10). Scale bars: 25 μm. |
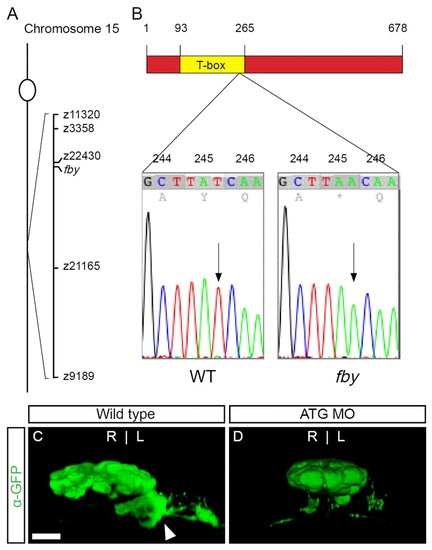
The fby mutation is a premature stop codon in the tbx2b gene. (A) Diagram of zebrafish chromosome 15, showing the location of the fby mutation relative to nearby SSLP markers. (B) In fbyc144 mutants, the third position of codon 245 in the tbx2b gene was transverted from T to A, generating a stop codon within the T-box sequence. (C,D) Frontal views of 4-dpf larvae. Compared with uninjected foxd3:gfp controls (C), injection of an antisense morpholino against the start codon of tbx2b (ATG MO) resulted in a similar phenotype to the fby mutation (D). Scale bar: 25 μm. EXPRESSION / LABELING:
|
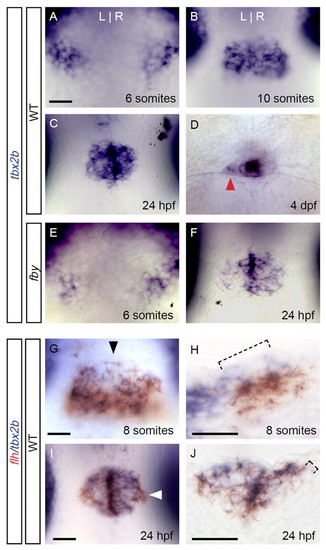
tbx2b expression in the pineal complex. (A-G,I) Dorsal views of zebrafish embryos or larvae at the indicated stages of development. (H) A sagittal section at the level of the arrowhead in G. (J) A transverse section at the level of the arrowhead in I. (A) Expression of tbx2b in the future epithalamus began at six somites, in two groups of cells at the lateral borders of the neural plate. (B,C) Following neural tube closure, a single tbx2b-expressing domain was detected at ten somites (B) and 24 hpf (C). (D) At 4 dpf, expression was maintained in the parapineal (arrowhead) and in the pineal stalk. (E,F) Expression of tbx2b was unchanged in fby mutants at ten somites (E) and 24 hpf (F). (G,H) Many tbx2b-expressing cells (blue) also expressed flh (red) in the future epithalamus at eight somites (G), although some tbx2b+ flh- cells were detected medially and dorsally (H, bracket). (I,J) By 24 hpf, tbx2b and flh were co-expressed in much of the pineal complex anlage (I), although expression of flh extended slightly more laterally and ventrally (J, bracket) than tbx2b. Scale bars: 25 μm. EXPRESSION / LABELING:
|
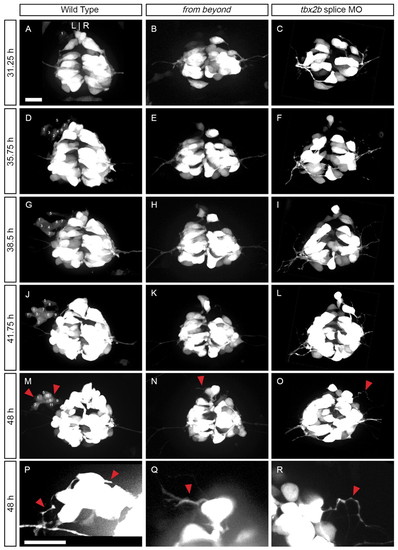
Parapineal cells do not migrate to the left side of the brain in fby mutants. Dorsal views of foxd3:gfp expression in live (A,D,G,J,M,P) WT, (B,E,H,K,N,Q) fby mutant or (C,F,I,L,O,R) tbx2b splice morpholino-treated embryos. The data are snapshots of time-lapse confocal movies imaged from 31 to 48 hpf. P,Q,R are magnified and contrast-enhanced regions of the anterior pineal complex from M,N,O, respectively. In WT embryos, GFP-labeled cells emerged from the anterior left end of the pineal complex as a chain of cells between 31 and 39 hpf. Cells are numbered in the order of their appearance. Cell 1 divided from 39.75 to 40.25, and its daughter is labeled 1′. Note that some parapineal cells (e.g. #3, 4, 7, 8) become hidden by overlying cells. Between 39 and 48 hpf, the parapineal cells compacted together, and extended long thin projections (red arrowhead). By contrast, fby mutants and tbx2b morpholino-treated embryos had no GFP-labeled cells migrating to the left, but cells at the anterior end of the pineal complex still extended long thin projections. Scale bar: 25 μm. |

The fby mutation disrupts formation of the pineal complex. (A,B) Dorsal and (C,D) frontal views of foxd3:gfp expression in the pineal complex of 4-dpf larvae. (A,C) In WT larvae, the parapineal organ (arrowhead) was a group of cells found to the left of and below the pineal organ. (B,D) In fby mutant larvae, the pineal complex was a single mass of cells, without a discrete parapineal organ. Scale bar: 25 μm. |

Parapineal migration is unaffected following disruption of the planar cell polarity pathway. (A-I) Dorsal views of the epithalamus in 24-hpf embryos (A-F) or 48-hpf larvae (G-I). Expression of otx5 (A-C) and tbx2b (D-F), and placement of the gfi1-positive parapineal cells (G-I), are unaffected in homozygous mutants for the planar cell polarity genes knypek (kny) or trilobite (tri). (J-Q) Lateral views of 24-hpf embryos. The Wnt receptor frz7a (blue) and the Wnt ligand wnt11 (blue) are excluded from the otx5-positive cells (red, arrowhead) of the pineal complex in WT (J-M) and fby mutant (N-Q) embryos. Scale bars: 25 μm in A-I,K,M,O,Q; 100 μm in J,L,N,P. |

Unillustrated author statements PHENOTYPE:
|