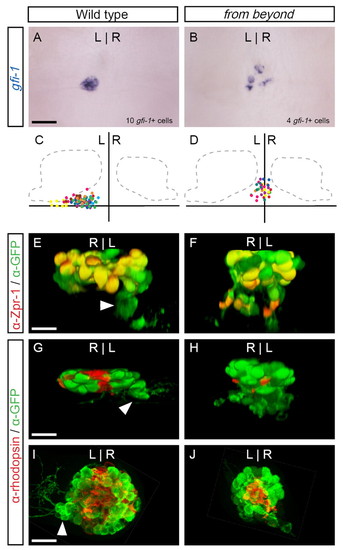
Fewer and misplaced parapineal cells in fby mutants. (A-D,I,J) Dorsal and (E-H) frontal views of 4-dpf zebrafish larvae. (A) In the epithalamus, expression of gfi1 was exclusive to the parapineal cells of WT larvae at 4 dpf, which formed a compact organ. (B) In fby mutants, fewer gfi1-expressing cells developed than in WT, and they were found as individual cells in the middle of the brain. (C,D) The position of gfi1-expressing cells from ten individual WT (C) or fby (D) larvae as represented by different colored dots for each sample. The vertical axis divides the left and right sides of the brain, and the horizontal axis is the posterior border of the habenular nuclei. (E) Double immunofluorescent labeling of a WT larva with foxd3:gfp (green) and the antibody Zpr1 (red). Zpr1 labels red-green double cone cells, which were almost exclusively found in the pineal but not the parapineal (arrowhead). (F) In fby mutants, Zpr1 labeled cells were found throughout the pineal complex, including cells ventral to the pineal organ. (G-J) Double labeling with foxd3:gfp (green) and anti-rhodopsin antibody (red). Rhodopsin-expressing cells were near the dorsal midline of the pineal organ in WT (G,I) and (H,J) fby mutant larvae. Scale bars: 25 μm.
|
