
- Title
-
Down-regulation of coasy, the gene associated with NBIA-VI, reduces Bmp signaling, perturbs dorso-ventral patterning and alters neuronal development in zebrafish
- Authors
- Khatri, D., Zizioli, D., Tiso, N., Facchinello, N., Vezzoli, S., Gianoncelli, A., Memo, M., Monti, E., Borsani, G., Finazzi, D.
- Source
- Full text @ Sci. Rep.
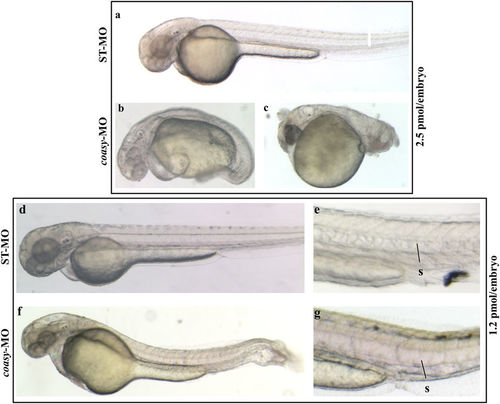
Phenotypic changes due to coasy-MO microinjection. Representative images of embryos injected with 2.5 or 1.2?pmol/embryo of ST-MO (a,d,e) or coasy-MO (b,c,f,g) at 48 hpf. Embryos injected with high doses of coasy-MO showed a severely aberrant phenotype [(B, 64%) and (C, 36%)]. Embryos injected with 1.2?pmol/embryo of coasy-MO (f,g) showed a milder phenotype. PHENOTYPE:
|
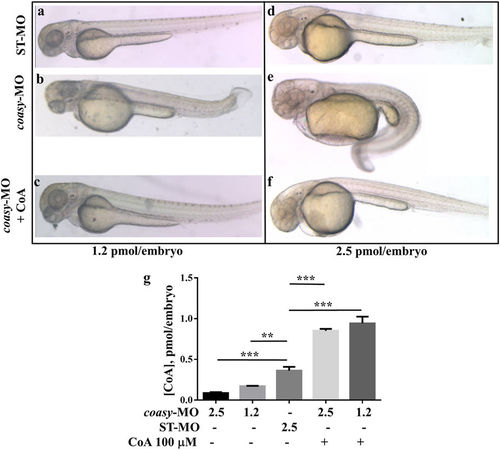
Morphological rescue by treatment with CoA. Morphological comparison of ST-MO- (a,d), coasy-MO-injected embryos (b,e) and morphants treated with 100??M CoA at 48 hpf (c,f). Embryos were injected with 1.2 (a?c) or 2.5?pmol/embryo (d?f). Embryos exposed to CoA showed a significant correction of the aberrant phenotype, in particular the antero-posterior development, brain and somites formation. All images are lateral views. The graph in panel G shows the mean CoA content (pmol/embryo) as measured by a specific LC-MS/MS method on extracts from embryos injected with ST-MO or coasy-MO, eventually treated with 100??M CoA. PHENOTYPE:
|
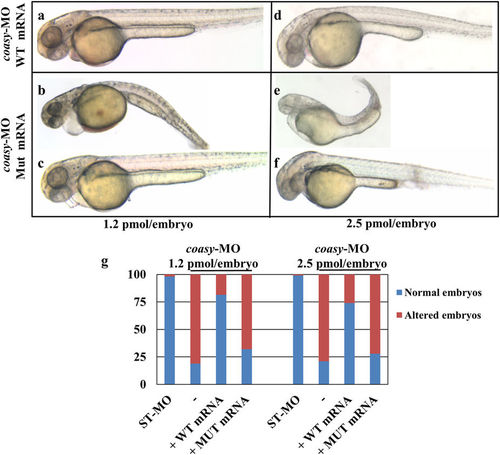
Rescue of coasy knock-down by injection of human mRNA. Morphological analysis of morphants co-injected with human COASY mRNA, either wild type (a,d) or mutated (b,c,e,f) at 48 hpf. Morpholinos were used at either 1.2 (a?c) or 2.5?pmol/embryo (d?f). Images are from a representative experiment out of four independently performed. The graph in G shows the total distribution of the different phenotypes observed in injected embryos (4 experiments). |
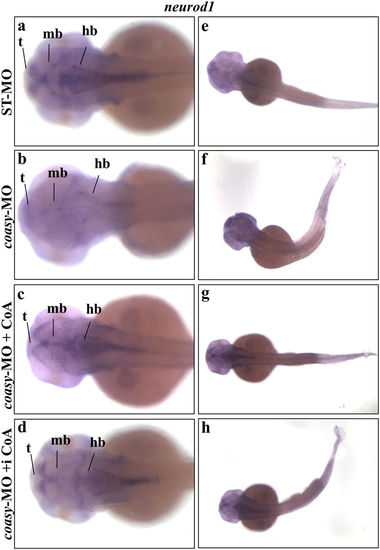
Analysis of neurod1 neural marker in coasy-morphants. Representative images of WISH analyses of neurod1 expression in coasy morphants at 48 hpf. Dorsal views of ST-MO- (a,e) and coasy-MO-injected embryos (b?h), eventually exposed to CoA in fish water (c,g) or injected with CoA in the brain ventricle at 24 hpf (d,h). For each panel, results of one representative experiment with at least 40 embryos out of two independent replicates are shown. Abbreviations: d, diencephalon; tg, tegmentum; t, telencephalon; hb, hindbrain; hbn, hindbrain neurons; llg, lateral line ganglia; mb, midbrain; snc, spinal cord neurons. |
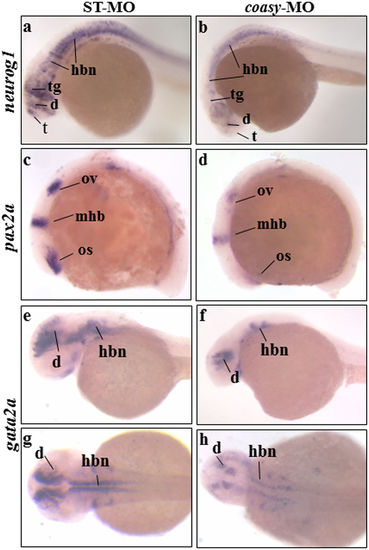
Analysis of neurog1, pax2a and gata2a neural markers in coasy morphants. Representative images of WISH analyses with neurog1, pax2a and gata2a riboprobes. neurog1 in ST-MO- (a), and coasy-MO-injected embryos (b) at 24 hpf, lateral views. Pax2a expression in ST-MO- (c), and coasy-MO-injected embryos (d) at 15 hpf, lateral views. Gata2a expression in ST-MO- (e,f), and coasy-MO-injected embryos (g,h) at 17 hpf (e,f lateral views and g,h dorsal views). Results are from one representative experiment with at least 40 embryos out of two independent replicates. Abbreviations: d, diencephalon; hb, hindbrain; mhb, midbrain-hindbrain boundary; os optic stalk; ov, otic vesiscle; pd, pronephritic ducts. EXPRESSION / LABELING:
PHENOTYPE:
|
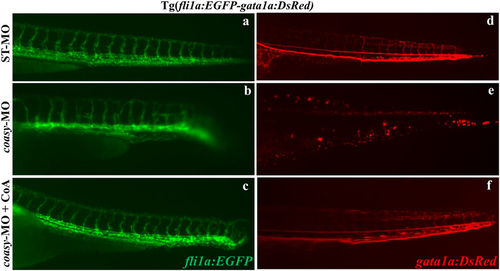
Effects of coasy-MO microinjection in the transgenic line Tg(fli1a:EGFP- gata1a:DsRed). Lateral views of the trunk/tail regions of Tg(fli1a:EGFP-gata1a:DsRed) embryos injected with either ST-MO (a,d) or coasy-MO (b,c,e,f) at 1.2?pmol/embryo, eventually exposed to CoA in fish water (c,f) and analyzed at 40 hpf. fli1a (EGFP) marks vascular development, and gata-1 (DsRed) marks red blood cells. In coasy morphants compromission of the vascular system and particularly of the intersegmental vessels is evident (c,d) and associated with reduction in the number of blood cell (e,f). Results are from one representative experiment with at least 80 embryos out of three independent replicates. PHENOTYPE:
|
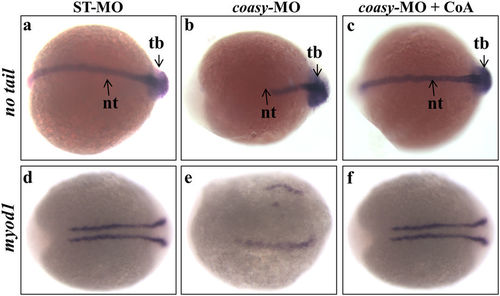
Analysis of no tail and myod1 expression in coasy-morphants. Representative dorsal view images of WISH analyses of no tail (at 17 hpf) and myod1 (at 16 hpf) expression in ST-MO- (a,d) and coasy-MO-injected embryos (b,c,e,f), eventually exposed to CoA in fish water (c,f). Results are from one representative experiment with about 80 embryos out of two independent replicates. EXPRESSION / LABELING:
PHENOTYPE:
|
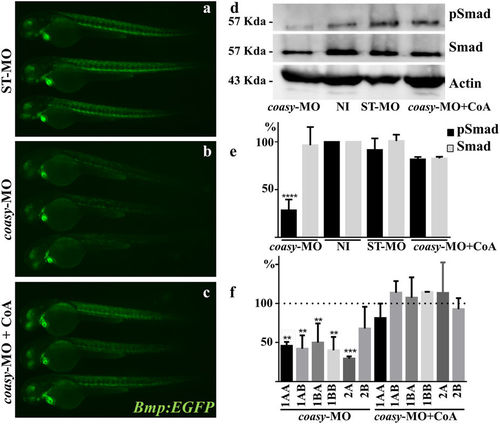
Analysis of Bmp activity in coasy-morphants. Representative images of Tg(Bmp:EGFP) embryos injected with ST-MO (a) or coasy-MO (1.2?pmol/embryo, b and c), eventually exposed to CoA in fish water (c), at 60 hpf. A net reduction of the fluorescence intensity is evident in coasy-morphants. Results are from one representative experiment with at least 25 embryos out of two independent replicates. (d) Western blotting analysis of the amount of phosporylated Smad-5, total Smad, and Actin in embryos injected with coasy-MO (�CoA) or ST-MO (1.2?pmol/embryo), and not-injected (NI). Full size images of the gels are shown in Supplementary Fig. S7) The graph shows the quantitative analysis of the immunoblotting. (f?) Real-time RT-PCR quantification of different Bmp receptor mRNAs in morphants at 48 hpf, eventually treated with CoA in fish water. Mean values are form three independent experiments and expressed as percentage of the value in ST-MO injected embryos. |
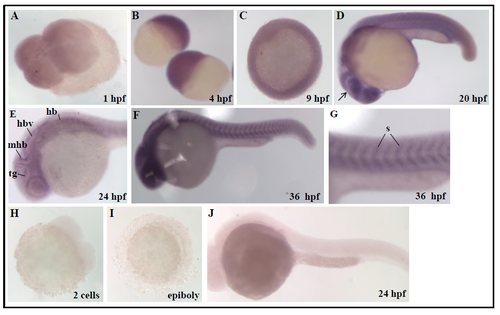
Expression pattern of coasy transcript during zebrafish development Spatiotemporal analysis of coasy expression by WISH using a coasy-specific probe. WISH was performed from 0.2 hpf (1-2 cells) to 36 hpf with a coasy-specific antisense probe. (A) Dorsal view, four cells stage; (B) lateral view, sphere stage; (C) dorsal view, germ ring. (D-G) 20, 24, 36 hpf lateral views; (G) 36 hpf lateral view, magnification of somites. For each stage, at least 30 embryos were analyzed in two independent experiments. mhb, midbrain-hindbrain boundary; h, hindbrain; hbv, hindbrain ventricle; tg, tegmentum; s, somites. A digoxigenin-labelled, coasy sense probe was synthezised as described in Material and Methods and applied for in situ hybridization with embryos at different developmental stages (H-J). No specific labelling was evident at any stage. Rapresentative images from one experiment performed with at least 30 embryos and repeated twice. |

ZFIN is incorporating published figure images and captions as part of an ongoing project. Figures from some publications have not yet been curated, or are not available for display because of copyright restrictions. |
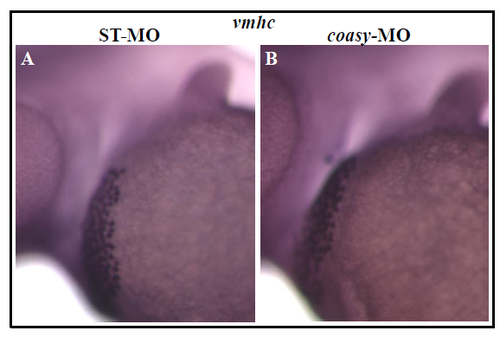
coasy deficency does not affect heart development. Stereomicroscope lateral views of WISH analysis with vmhc probe on ST-(A) and coasy-MO (B) injected-embryos (1.2 pmol/embryo) at 48 hpf. vmhc marks the hearth ventricle. The experiment was performed with 25 embryos and repeated twice. |
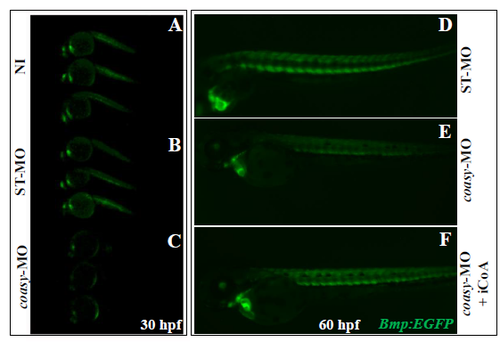
Bmp activity at 30 hpf in the transgenic line Tg(MBmp:EGFP) and rescue by CoA injection Representative images of Tg(Bmp:EGFP) embryos not-injected (A, B) and injected with 1.2 pmol/embryo of ST-MO (C, D) or coasy-MO (E, F) at 30 hpf. A net reduction of the fluorescence intensity is evident in coasy-morphants. Results are from one representative experiment with at least 38 embryos out of two independent replicates. CoA (0.5 pmol/embryo) was injected in the craniofacial area of Tg(Bmp:EGFP) morphants at 24 hpf (I) and Bmp activity compared to that of untreated embryos (G, H) at 60 hpf. One representative experiment out of two replicates. |
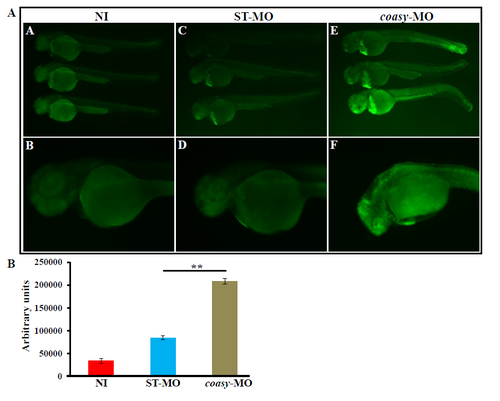
Acridine Orange staining. A) Representative images of embryos not-injected (A, B) and injected with 1.2 pmol/embryo of ST-MO (C, D) or coasy-MO (E, F) at 48 hpf obtained by acridine orange staining to assess the presence of dead cells. Morphants show a significant increase of the fluorescence staining, particularly in brain and tail. B) The quantification of the fluorescence intensity performed by a plate reader shows a significant (P<0.001), 2.5-fold increase in coasy-MO-injected embryos. Results are from a representative experiment with at least 50 embryos, repeated at least three times. PHENOTYPE:
|