
IMAGE
Fig. S10
- ID
- ZDB-IMAGE-171205-4
- Publication
- Khatri et al., 2016 - Down-regulation of coasy, the gene associated with NBIA-VI, reduces Bmp signaling, perturbs dorso-ventral patterning and alters neuronal development in zebrafish
- All Figures
- Figures for Khatri et al., 2016
Image
|
Figure Caption
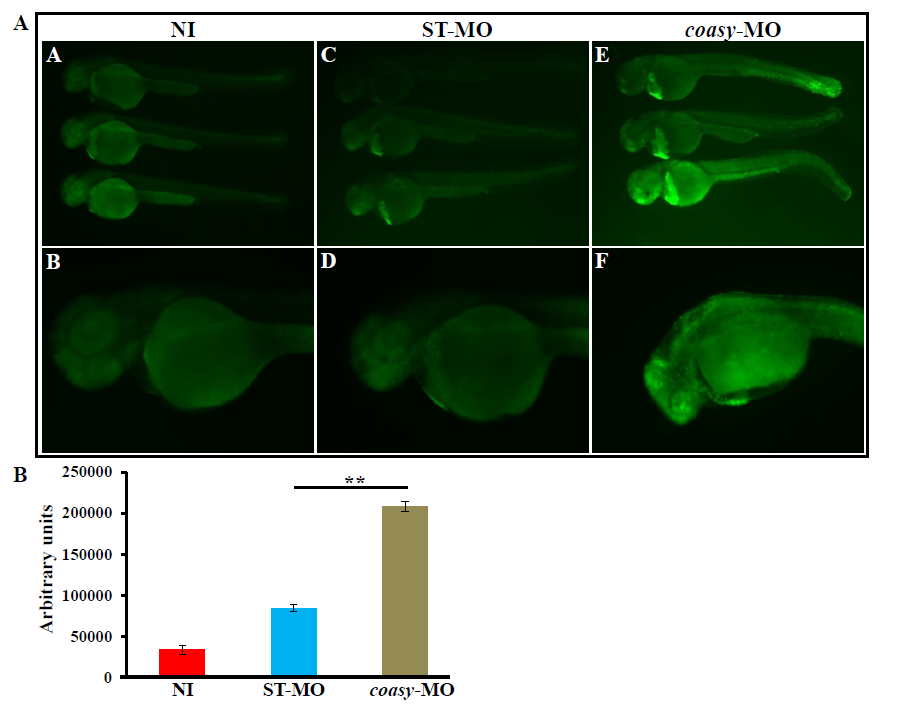
Fig. S10
Acridine Orange staining.
A) Representative images of embryos not-injected (A, B) and injected with 1.2 pmol/embryo of ST-MO (C, D) or coasy-MO (E, F) at 48 hpf obtained by acridine orange staining to assess the presence of dead cells. Morphants show a significant increase of the fluorescence staining, particularly in brain and tail. B) The quantification of the fluorescence intensity performed by a plate reader shows a significant (P<0.001), 2.5-fold increase in coasy-MO-injected embryos. Results are from a representative experiment with at least 50 embryos, repeated at least three times.
Figure Data
Acknowledgments
This image is the copyrighted work of the attributed author or publisher, and
ZFIN has permission only to display this image to its users.
Additional permissions should be obtained from the applicable author or publisher of the image.
Full text @ Sci. Rep.