
- Title
-
Sim1a and Arnt2 contribute to hypothalamo-spinal axon guidance by regulating Robo2 activity via a Robo3-dependent mechanism
- Authors
- Schweitzer, J., L�hr, H., Bonkowsky, J.L., H�bscher, K., and Driever, W.
- Source
- Full text @ Development
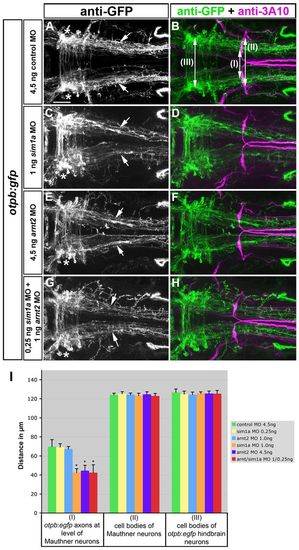
Sim1a and Arnt2 act synergistically during longitudinal HTS axon guidance. Dorsal views of hindbrain confocal z-projections of otpb:gfp transgenic embryos at 72 hpf. Anterior is towards the left. (A-H) Mediolateral positioning of otpb:gfp axons (arrows) after indicated treatments. otpb:gfp hindbrain neurons (asterisks in A,C,E,G) do not contribute to longitudinal projections. (I) Quantification of the distance between otpb:gfp axons (I), of the distance between MA neurons (II) or between otpb:gfp hindbrain neurons (III). *P<0.0001 for sim1a MO 1.0 ng, arnt2 MO 4.5 ng, arnt2/sim1a MO 1.0/4.5 ng versus control MO 4.5 ng. Scale bar: 50 μm. EXPRESSION / LABELING:
PHENOTYPE:
|

Temporally controlled sim1a knockdown reveals medial displacement of dopaminergic longitudinal projection tracts. Dorsal views of confocal z-projections of 72 hpf embryos at the anterior-posterior levels of forebrain (A,C,E,G) and hindbrain (B,D,F,H). (A,B) Control MO injection. (C,D) sim1a morpholino injection: TH immunoreactivity is lost in cell bodies (C) and axons (D) of the DA HTS systems (DA groups 2,4-6). (E,F) Caging the sim1a morpholino results in wild-type-like formation of DA HTS systems. (G,H) Temporally controlled activation of sim1a MO at 22 hpf permits the formation of individual group 2,4-6 DA neurons (G) but causes a medial shift of TH-positive axons (arrows in H). Arrowheads in B indicate the position of TH-positive HTS tracts. Asterisks in B,D,F,H indicate TH-positive locus coeruleus (LC) neurons. Numbers in A,C,E,G indicate DA groups (Rink and Wullimann, 2002). (I) Quantification of mediolateral positioning of TH-positive HTS axons at 72 hpf at the level of LC neurons (IV in B); of distances of group 2 (I in A) and group 4 cells (II in A) from the midline; and of distances between LC neurons (III in B). ***P<0.0001; n.s., not significant. Scale bar: 50 μm. EXPRESSION / LABELING:
PHENOTYPE:
|

Lateral positioning of longitudinal axons derived from otpb- and hypocretin-positive neurons is altered in ast homozygous mutants. Dorsal views of hindbrain confocal z-projections of otpb:gfp;hcrt:tdtomato double transgenic 72 hpf embryos. (A-F) In ast/ast embryos longitudinal projections of otpb:gfp (D,F; arrows in D) and hcrt:tdtomato (E,F; arrowheads in E) axons are shifted towards the midline compared with ast/+ siblings. (G) Quantification of the distance between otpb:gfp and hcrt:tdtomato HTS axons at the anterior-posterior level of Mauthner neurons, and of the distance between Mauthner neurons. ***P<0.0001; n.s., not significant. Scale bar in A for A-F: 50 μm. EXPRESSION / LABELING:
PHENOTYPE:
|
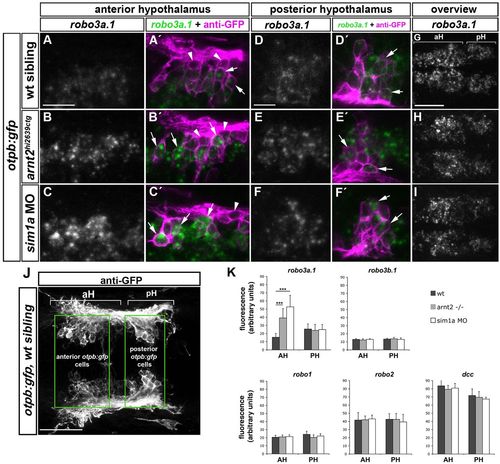
Spatiotemporal expression of robo3a.1 in the hypothalamus is altered in sim1a morphants and arnt2 mutants. Dorsal views of confocal z-projections of 48 hpf embryos. Anterior is towards the left. (A-F′) High magnification of otpb:gfp cells in anterior (aH) or posterior hypothalamus (pH). (A,A2) Expression of robo3a.1 is detected at low levels in a subset of GFP-positive cells (arrows in A′) in otpb:gfp embryos (B-C′). Instead, otpb:gfp; arnt2hi2639c mutant embryos (B,B′) and otpb:gfp embryos injected with sim1a MO (C,C′) show strong robo3a.1 signal in GFP-positive cells (arrows in B′ and C′). (D-F′) Expression levels of robo3a.1 are comparable in GFP-positive cells in pH of otpb:gfp embryos (D,D2), otpb:gfp; arnt2hi2639c mutants (E,E′) and otpb:gfp embryos injected with sim1a MO (F,F′). Arrowheads indicate GFP-positive cells, which do not express robo3a.1. (G-I) Overview of the robo3a.1 expression domain in the hypothalamus of otpb:gfp embryos (G), otpb:gfp; arnt2hi2639c mutant embryos (H) and otpb:gfp embryos injected with sim1a MO (I). (J,K) Quantification (K) of Alexa-488 signal intensity derived from fluorescent in situ hybridization staining for indicated genes in otpb:gfp cells located in aH or pH (J). ***P<0.0001. Scale bars: in A, 20 μm for A-C′; in D, 10 μm for D-F2 in G, 50 μm for G-I. EXPRESSION / LABELING:
|

Robo3 is required for lateral positioning of otpb:gfp-positive longitudinal axons. Dorsal views of confocal hindbrain z-projections (72 hpf) are shown. Anterior is towards the left. (A,B) In twt/+ embryos, otpb:gfp longitudinal axons in the midbrain (A, arrowheads) and hindbrain (A, arrows) grow by a defined distance towards the midline. Arrows in B indicate Mauthner neuron somata. (C,D) In twt/twt embryos, otpb:gfp longitudinal axons project more laterally in the midbrain (C, arrowheads) and hindbrain (C, arrows). (E) Quantification of the separation between otpb:gfp longitudinal axons in mid- and hindbrain (double-headed arrows, II and V in B) and between nucMLF somata (I, see asterisks in B), MLF axons (IV) or MA neurons (III) in twt/+ or twt/twt embryos. (F,G) In sim1a MO-injected twt/+ embryos, otpb:gfp longitudinal axons are medially displaced (F, arrows). (H,I) In sim1a MO-injected twt/twt embryos, otpb:gfp longitudinal axons project more laterally (H, arrows). (J) Quantification of the distance between MA neurons (II, marked in G) and vagal axons (IV in H), or of the distance between otpb:gfp longitudinal axons (I in H and III in G) in sim1a MO-injected twt/+ and twt/twt embryos. Arrowheads in B,D,G,I indicate pathfinding of Mauthner neurons in twt/+ and twt/twt embryos. *P<0.001. Scale bar: 50 μm. EXPRESSION / LABELING:
PHENOTYPE:
|
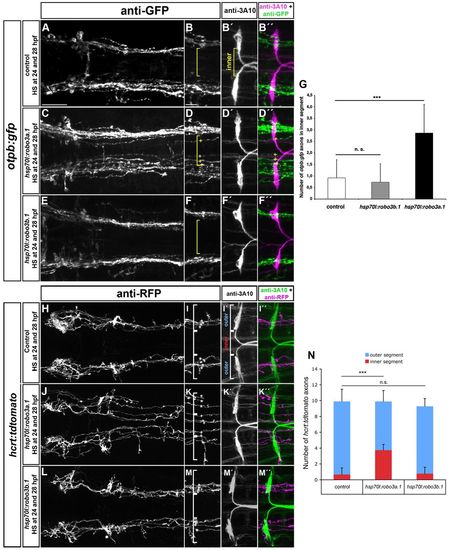
Ectopic expression of robo3a.1 is sufficient to induce medial displacement of HTS axons. (A-F′′,H-M′′) Dorsal views of confocal z-projections of brain regions of 48 hpf (A-F′′) and 72 hpf (H-M′′) embryos. Anterior is towards the to left. (A-B′′,H-I′′) Heat-shock treatment does not affect pathfinding of otpb:gfp or hcrt:tdtomato longitudinal axon in control embryos. (C-D′′,J-K′′) Longitudinal otpb:gfp or hcrt:tdtomato axons are medially displaced after heat shock-induced overexpression of robo3a.1. (E-F′′,L-M′′) Pathfinding of otpb:gfp or hcrt:tdtomato longitudinal axons is normal after overexpression of robo3b.1. (G,N) Quantification of the number of otpb:gfp or hcrt:tdtomato longitudinal axons in defined outer or inner sections. Brackets in B,B′,D,F, I,I′,K,M, indicate outer and inner sections as defined by Mauthner neuron somata (outer section) and the area in between (inner section) used for quantification. Asterisks and plus signs indicate longitudinal HTS axons in outer and inner sections, respectively. Scale bars: in A, 50 μm for A,C,E,H,J,L; in B, 25 μm for B-B′′,D-D′′,F-F′′,I-I′′,K-K′′,M-M′′. EXPRESSION / LABELING:
PHENOTYPE:
|
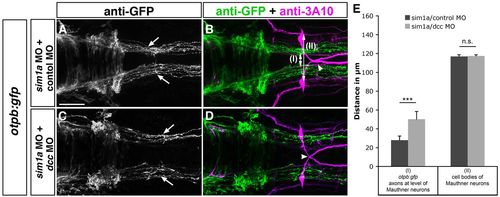
Dcc-mediated attraction causes medial displacement of otpb:gfp longitudinal axons after sim1a knockdown. Dorsal views of hindbrain confocal z-projections of 48 hpf otpb:gfp embryos. Anterior is towards the left. (A-D) GFP-positive longitudinal axons are medially displaced towards the midline (A, arrows) after co-injection of sim1a MO and control MO in otpb:gfp embryos. Medial displacement of longitudinal otpb:gfp axons (C, arrows) is reduced after combined injection of sim1a MO and dcc MO. (E) Quantification of the distance between otpb:gfp-positive longitudinal axons (I) or of the distance between Mauthner neurons (II) of indicated treatments. Arrowheads in B,D indicate normal midline crossing of MA neurons. *P<0.001; n.s., not significant. Scale bar: 50 μm. |

Medial displacement phenotype of otpb:gfp longitudinal HTS axons is not affected by depletion of sim1a in ast/ast; twt/+ and ast/ast; twt/twt embryos. Dorsal views of hindbrain confocal z-projections of 72 hpf otpb:gfp embryos. Anterior is towards the left. (A,B) otpb:gfp HTS axons (arrows) in a wild-type sibling. (C-H) Phenotypic strength of medial displacement of otpb:gfp-positive longitudinal axons is similar in ast/ast; twt/twt embryos injected with control MO (C, arrows), and in ast/ast; twt/+ (E, arrows) or ast/ast; twt/twt (G, arrows) sim1a morphant embryos. Arrowheads in B,D,F,H indicate pathfinding of Mauthner neurons. (I) Quantification of the distance between of otpb:gfp longitudinal axons and vagal axons, and of the distance between Mauthner neurons in ast/ast; twt/twt embryos injected with control MO, and in ast/ast; twt/+ or ast/ast; twt/twt embryos injected with sim1a MO. n.s., not significant. Scale bar: 50 μm. EXPRESSION / LABELING:
PHENOTYPE:
|

Overexpression of robo3a.1 leads to increased medial displacement of longitudinal HTS axons in astte284 but not in astti272z embryos. Dorsal views of confocal z-projections of the brain and hindbrain of 72 hpf hcrt:tdtomato embryos. Anterior is towards the left. (A-H) Medial displacement phenotype of hcrt:tdtomato HTS axons is similar in astti272z/ti272z and astti272z/ti272z; hsp70l:robo3a.1 embryos after heat-shock treatment. (J-Q) Medial displacement phenotype of hcrt:tdtomato HTS axons is increased in astte284/te284; hsp70l:robo3a.1 embryos when compared with astte284/te284 embryos. (I,R) Quantification of the number of hcrt:tdtomato longitudinal axons in outer or inner sections in astti272z (I) or astte284 (R). Brackets in B,C,F,K,O indicate outer and inner sections used for quantification, defined by Mauthner neuron somata (outer section) and the area in between (inner section). Asterisks and plus signs indicate longitudinal hcrt:tdtomato axons in outer and inner sections, respectively. Scale bars: in A, 50 μm for A,E,J,N; in B, 25 μm for B-D,F-H,K-M,O-Q. EXPRESSION / LABELING:
PHENOTYPE:
|
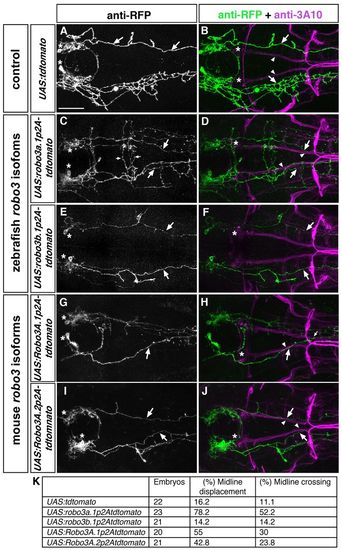
The N-terminal domain present in Robo3A isoforms is important for interfering with Robo2-dependent repulsion. Dorsal views of hindbrain confocal z-projections of 72 hpf embryos. Anterior is towards the left. Embryos were co-injected with hcrt:gal4 and UAS constructs indicated on the left. (A,B) Hcrt neurons form tdTomato-positive longitudinal axons (A, arrows), which project laterally (B, arrows) to the MLF (B, arrowheads). (C,D) After mis-expression of robo3a.1 in Hcrt neurons, tdTomato-positive longitudinal axons are medially displaced towards the midline (C,D, arrows) and project together with the medial longitudinal fascicle (D, arrowheads). Small arrows indicate ectopic midline crossing events (C). (E,F) Upon mis-expression of robo3b.1 in Hcrt neurons, tdTomato-positive longitudinal axons project normally (E,F, arrows). (G-J) After mis-expression of mouse Robo3A.1 (G,H) or Robo3A.2 (I,J) in Hcrt neurons, tdTomato-positive longitudinal axons are displaced towards the midline (G-J, arrows) and project together with the medial longitudinal fascicle (H,J, arrowheads). Small arrow in H indicates midline crossing. (K) Quantification. Asterisks in A,C,E,G,I indicate Hcrt neurons, asterisks in B,D,F,H,J indicate nucMLF neurons. Scale bar: 50 μm. |

The otpb:gfp reporter line recapitulates many aspects of endogenous otpb expression in the forebrain. (A) Dorsal views of confocal z projections of the forebrain region of otpb:gfp transgenic embryos at 24 hpf, demonstrating co-expression of gfp (green) and otpb (red), as well as co-expression of gfp (green) and sim1a (red) analyzed by double fluorescent in situ hybridization are shown. Scale bar: 50 μm. (B) Dorsal views of otpb:gfp transgenic embryos at 24 hpf co-labeled with anti-GFP (green), anti-TH (red) and anti-ZN12. Dopaminergic TH-positive cell bodies and longitudinal dopaminergic projections are immunoreactive for GFP (arrows). Scale bar: 100 μm. (C) Dorsal (left panel) and lateral views (right panel) of otpb:gfp transgenic embryos at 72 hpf analyzed for co-expression of hypothalamic neurohormones (shown in blue) and gfp (shown in purple) by double in situ hybridization. Oxytocin-like (oxtl), arginine vasopressin-like (avpl), corticotropin releasing hormone (crh), thyrotropin releasing hormone (trh) and somatostatin 1 (sst1) transcripts in the preoptic region all colocalize with gfp expression (see arrowheads). Scale bar: 50 μm. PT, posterior tuberculum; H, hypothalamus; PO, preoptic region. |

Lateral positioning of longitudinal otpb:gfp-positive axons is altered in arnt2hi2639c mutants. Dorsal views of confocal z projections of the hindbrain of otpb:gfp transgenic embryos co-labeled with anti-GFP and anti-3A10 (A-D) at 72 hpf are shown. (A,B) Wild-type siblings display normal medio-lateral positioning of otpb:gfp positive axons (arrows in A). (C,D) In arnt2hi2639c/hi2639c homozygous mutants, longitudinal projections of otpb:gfp axons are shifted towards the midline (arrows in C). Midline crossing of Mauthner axons is not affected in arnt2hi2639c mutants, suggesting grossly normal hindbrain development (compare arrowheads in B,D). (E) Quantification of mediolateral positioning of otpb:gfppositive longitudinal axons at the anterior-posterior level of Mauthner neurons (see III in B), of the distance of MA neurons (see II in B) and of otpb:gfp hindbrain neurons (see I in B) in arnt2hi2639c/hi2639c homozygous mutants or wild-type siblings. Numbers in parentheses indicate the number of embryos analyzed. ***P<0.0001; n.s., not significant. Scale bar: 50 μm. |

Loss of Sim1a function causes medial displacement of longitudinal otpb:gfp-positive axons. Dorsal views of hindbrain confocal z projections of otpb:gfp;hcrt:tdtomato double transgenic embryos at 72 hpf. (A-F) otpb:gfp axons (arrows in D,F) in sim1a morphants display strong medial displacement compared with controls (A,C) hcrt:tdtomato axons (arrowheads in B,C,E,F) are not affected. otpb:gfp hindbrain neurons (asterisks in A,D) do not contribute to longitudinal projections. (G) Quantification of mediolateral positioning of otpb:gfp and hcrt:tdtomato axons at the level of Mauthner neurons at 72 hpf after control or sim1a MO injection. ***P<0.0001; n.s., not significant. Scale bar: 50 μm for A-F. |
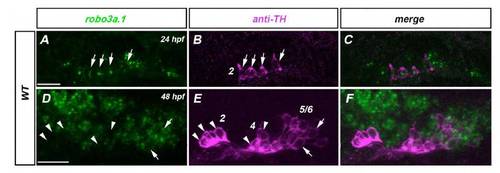
Expression of robo3a.1 during development of hypothalamic DA neurons. Dorsal views of confocal z projections at the anterior-posterior level of the hypothalamus at indicated developmental stages. Anterior is towards the left. Only the left side of the brain is depicted. (A-C) At 24 hpf, expression of robo3a.1 is found in group 2 TH-positive DA neurons (see arrows in A,B). (D-F) At 48 hpf, expression of robo3a.1 in group 2 and group 4 TH-positive DA neurons is almost undetectable (arrowheads in D-E), whereas group 5-6 TH-positive DA neurons express robo3a.1. Numbers in B and E indicate DA neuronal groups according to Rink and Wullimann (Rink and Wullimann, 2002). Scale bars: 25 μm. |
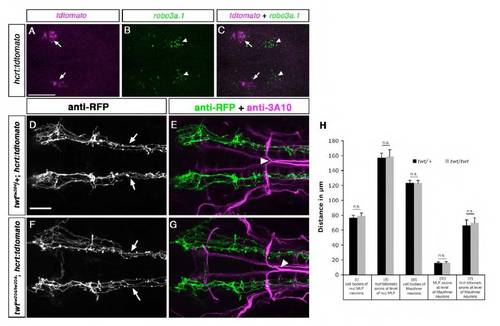
robo3 is not required for HTS longitudinal tract formation of Hcrt neurons. Dorsal views of confocal z projections of the brain of 24 hpf embryos (A-C) or hindbrain of 72 hpf embryos are shown. Anterior is towards the left. (A-C) Whole-mount fluorescent in situ hybridization for tdtomato and robo3a.1 expression in hcrt:tdtomato embryos are shown. robo3a.1 (arrowheads in B,C) was not detectable in Hcrt neurons (arrows in A,C). (D-G) Immunohistochemistry with anti-RFP and anti-3A10 antibodies demonstrates that pathfinding of TdTomato-positive longitudinal axons is similar in twttw204/+;hcrt:tdtomato (arrows in D) when compared with twttw204/+;hcrt:tdtomato embryos (arrows in F). Arrowheads in E indicate normal midline crossing of Mauthner axons in heterozygous robo3 embryos; arrowhead in G denotes abnormal crossing of Mauthner axons in homozygous robo3 mutants. (H) Quantification of the distance between nucMLF neurons (I) and MLF axons (III), hcrt:tdtomato longitudinal axons at two different positions (II +IV) and MA neurons (V) in twt/+ and twt/twt embryos. n.s., not significant. Scale bars: in A, 50 μm for A-C; in D, 50 μm for D-G. |
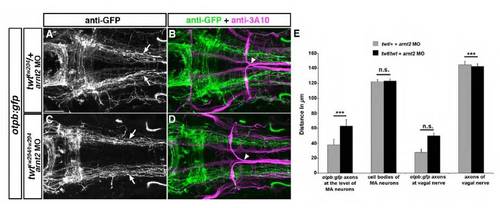
Medial displacement of otpb:gfp-positive longitudinal axons is reduced in robo3 mutants after arnt2 knockdown. Dorsal views of z projections of the hindbrain of 72 hpf embryos labeled with anti-GFP and anti-3A10 antibodies are shown. Anterior is towards the left. (A,B) In twttw204/+;otpb:gfp embryos injected with arnt2 MO otpb:gfp-positive longitudinal axons (arrows in A) grow towards the midline. Midline crossing of Mauthner axons is normal (arrowhead in B). (C,D) After knock down of arnt2 in twttw204/tw204;otpb:gfp embryos, longitudinal axons project in a wildtype manner (arrows in C). Abnormal crossing of Mauthner axons (arrowhead in D) indicates homozygous robo3 mutant. (E) Quantification of the distance of MA neurons and of medio-lateral positioning of otpb:gfp-positive longitudinal axons at the anterior-posterior level of Mauthner neurons and medio-lateral positioning of otpb:gfp vagal axons. *P<0.001, Student′s t-test; n.s., not significant). Scale bar: 50 μm. |
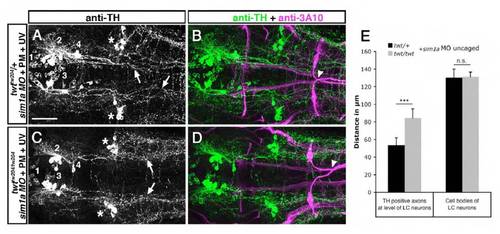
Medial displacement of TH-positive longitudinal axons in robo3 mutants is reduced after temporally controlled sim1a knockdown. Dorsal views of confocal z projections of the hindbrain of 72 hpf embryos labeled with anti-TH and anti-3A10 antibodies are shown. (A,B) Longitudinal TH-positive axons derived from group 2 and 4 DA neurons are shifted towards the midline (arrows in A) after photoactivation of sim1a MO at 22 hpf in twttw204/+ embryos. Midline crossing of Mauthner axons is normal (arrowhead in B). (C,D) After temporally controlled activation of sim1a MO in twttw204/tw204 embryos at 22 hpf, TH-positive longitudinal axons derived from group 2 and 4 DA neurons project in a wild-type-like fashion (arrows in C). Abnormal crossing of Mauthner axons (arrowhead in D) indicates homozygous robo3 mutant. (E) Quantification of medio-lateral positioning of TH-positive longitudinal axons in twttw204/+ and twttw204/tw204 embryos after temporally controlled activation of sim1a MO. Asterisks in A and C indicate noradrenergic locus coeruleus neurons. PM, photomorph; UV, ultra violet. Numbers in A and C indicate DA neuronal groups according to nomenclature of Rink and Wullimann (Rink and Wullimann, 2002). *P< 0.001, Student?s t-test; n.s., not significant. Scale bar: 50 μm for A-D. |
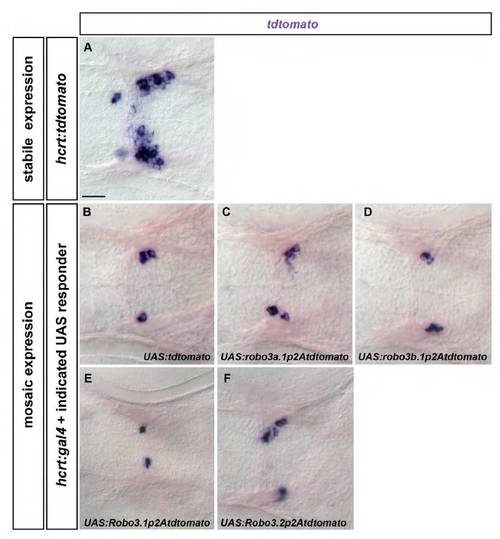
Expression of tdtomato derived from different UAS constructs co-injected with hcrt:gal4. Whole-mount in situ hybridization showing tdtomato expression. Dorsal views of the brain of 72 hpf embryos are shown. Anterior is leftwards. (A) Expression of tdtomato in a stabile hcrt:tdtomato transgenic embryo is shown to illustrate localization of hcrt neurons. (B-F) Similar levels of transient tdtomato expression can be detected after combined injection of hcrt:gal4 and the indicated UAS constructs. Developing time of the in situ hybridization signal for embryos shown in B-D or in E,F was equal. Scale bar: 25 μm. |
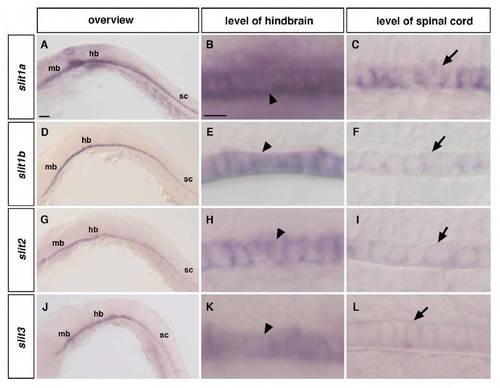
slit1, slit1b, slit2 and slit3 in situ hybridization at 24 hpf. Whole-mount in situ hybridization showing slit1a (A-C), slit1b (D,E), slit2 (G-I) and slit3 (J-L) expression. Lateral views of 24 hpf embryos (A,D,G,J), of the floor plate at the level of the hindbrain (B,E,H,K), and of the floor plate at the level of the spinal cord (C,F,I,L) are shown. Anterior to left. (A-L) Strong expression of the four different slit genes was found in midbrain and hindbrain regions when compared with spinal cord. Higher magnification revealed strong expression of the different slit genes within the floor plate at the level of the hindbrain (arrowheads in B,E,H,K) when compared with floor-plate cells at the level of the spinal cord (arrows in C,F,I,L) mb, midbrain; hb, hindbrain; sc, spinal cord. hb and sc labels also indicate the position of the floorplate regions shown in higher magnification. Scale bars: in A, 100 μm for A,D,G,J; in B, 50 μm for B,C,E,F,H,I,K,L. |