
|
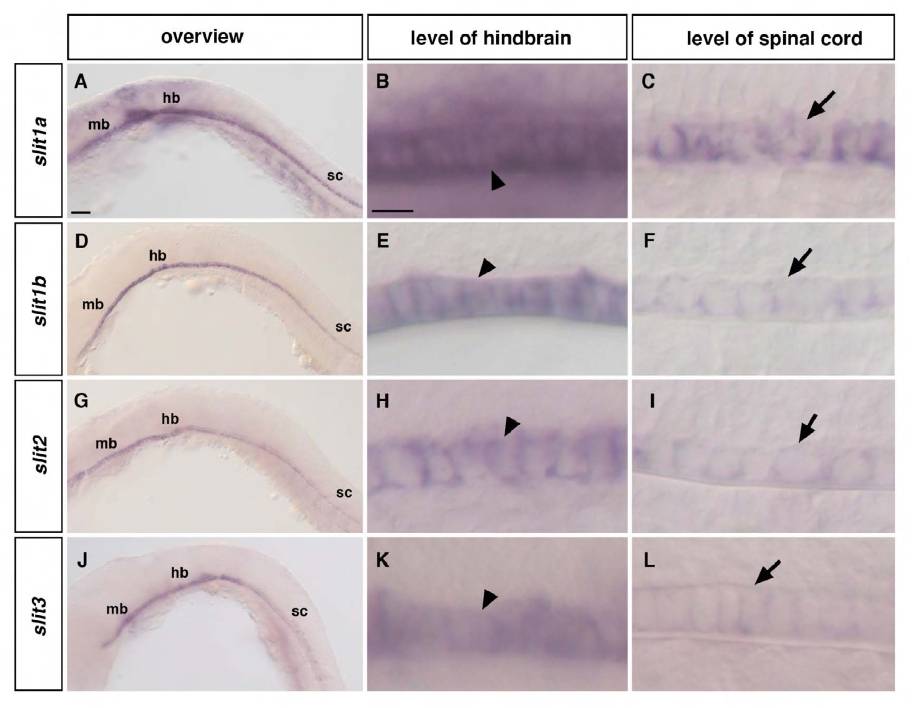
Fig. S10 slit1, slit1b, slit2 and slit3 in situ hybridization at 24 hpf. Whole-mount in situ hybridization showing slit1a (A-C), slit1b (D,E), slit2 (G-I) and slit3 (J-L) expression. Lateral views of 24 hpf embryos (A,D,G,J), of the floor plate at the level of the hindbrain (B,E,H,K), and of the floor plate at the level of the spinal cord (C,F,I,L) are shown. Anterior to left. (A-L) Strong expression of the four different slit genes was found in midbrain and hindbrain regions when compared with spinal cord. Higher magnification revealed strong expression of the different slit genes within the floor plate at the level of the hindbrain (arrowheads in B,E,H,K) when compared with floor-plate cells at the level of the spinal cord (arrows in C,F,I,L) mb, midbrain; hb, hindbrain; sc, spinal cord. hb and sc labels also indicate the position of the floorplate regions shown in higher magnification. Scale bars: in A, 100 μm for A,D,G,J; in B, 50 μm for B,C,E,F,H,I,K,L.