
Fig. 4
- ID
- ZDB-IMAGE-130123-51
- Genes
- Publication
- Schweitzer et al., 2013 - Sim1a and Arnt2 contribute to hypothalamo-spinal axon guidance by regulating Robo2 activity via a Robo3-dependent mechanism
- All Figures
- Figures for Schweitzer et al., 2013
|
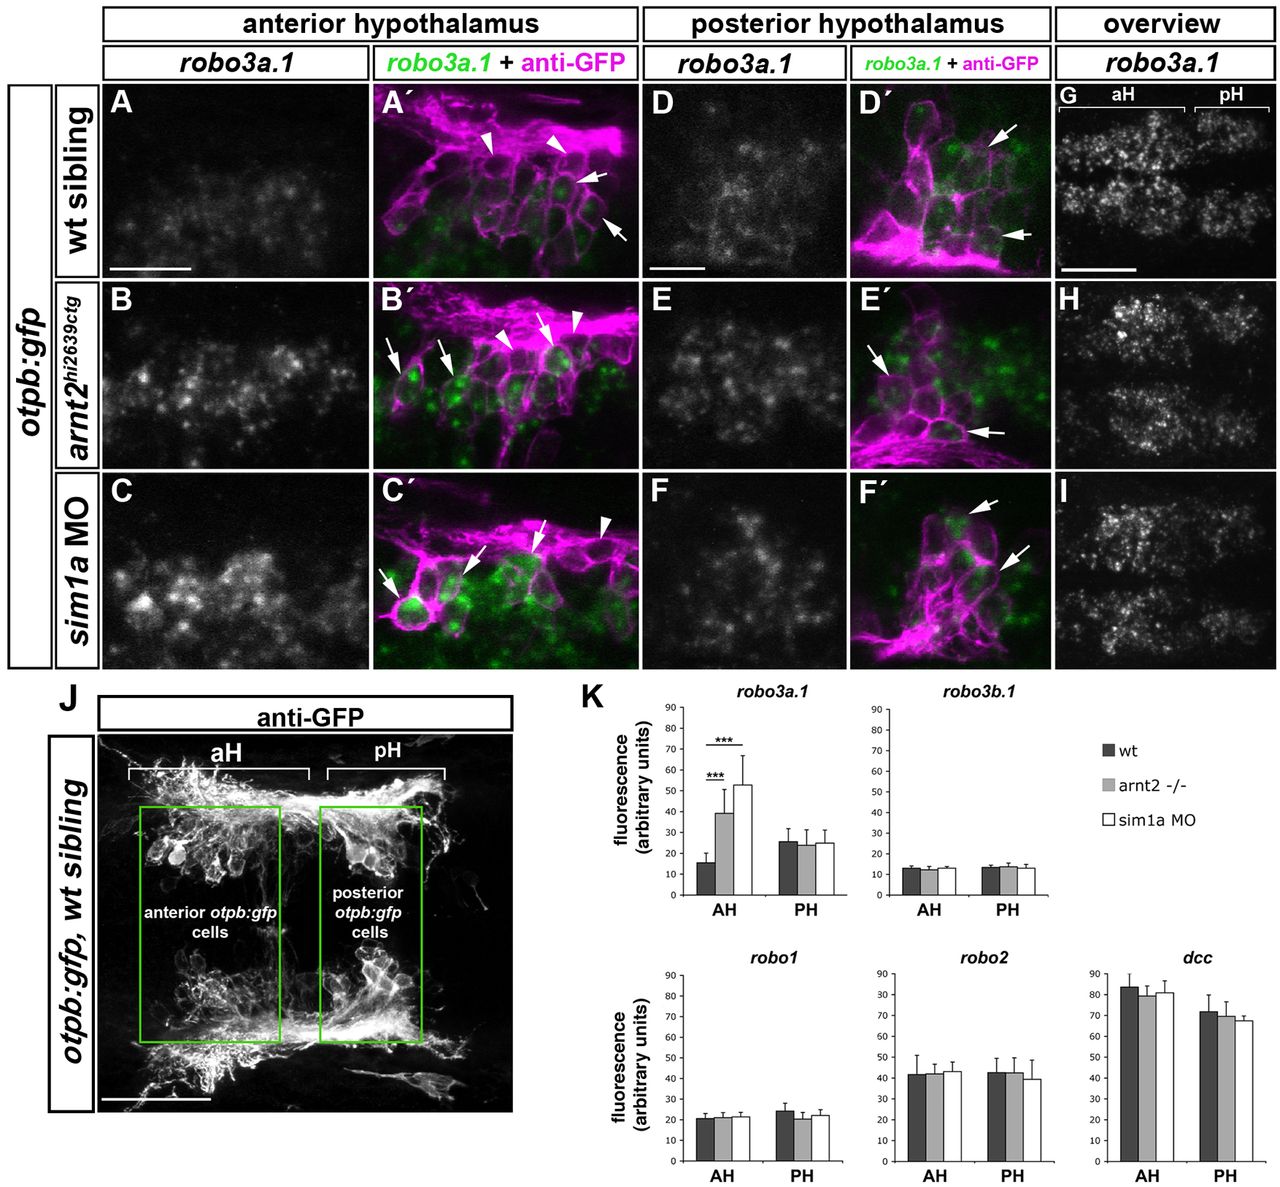
Fig. 4 Spatiotemporal expression of robo3a.1 in the hypothalamus is altered in sim1a morphants and arnt2 mutants. Dorsal views of confocal z-projections of 48 hpf embryos. Anterior is towards the left. (A-F′) High magnification of otpb:gfp cells in anterior (aH) or posterior hypothalamus (pH). (A,A2) Expression of robo3a.1 is detected at low levels in a subset of GFP-positive cells (arrows in A′) in otpb:gfp embryos (B-C′). Instead, otpb:gfp; arnt2hi2639c mutant embryos (B,B′) and otpb:gfp embryos injected with sim1a MO (C,C′) show strong robo3a.1 signal in GFP-positive cells (arrows in B′ and C′). (D-F′) Expression levels of robo3a.1 are comparable in GFP-positive cells in pH of otpb:gfp embryos (D,D2), otpb:gfp; arnt2hi2639c mutants (E,E′) and otpb:gfp embryos injected with sim1a MO (F,F′). Arrowheads indicate GFP-positive cells, which do not express robo3a.1. (G-I) Overview of the robo3a.1 expression domain in the hypothalamus of otpb:gfp embryos (G), otpb:gfp; arnt2hi2639c mutant embryos (H) and otpb:gfp embryos injected with sim1a MO (I). (J,K) Quantification (K) of Alexa-488 signal intensity derived from fluorescent in situ hybridization staining for indicated genes in otpb:gfp cells located in aH or pH (J). ***P<0.0001. Scale bars: in A, 20 μm for A-C′; in D, 10 μm for D-F2 in G, 50 μm for G-I.