
- Title
-
Characterization of Sleep in Zebrafish and Insomnia in Hypocretin Receptor Mutants
- Authors
- Yokogawa, T., Marin, W., Faraco, J., Pézeron, G., Appelbaum, L., Zhang, J., Rosa, F., Mourrain, P., and Mignot, E.
- Source
- Full text @ PLoS Biol.
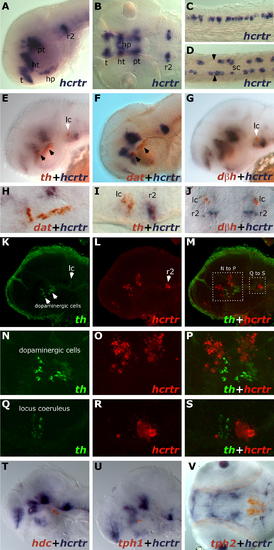
hcrtr Is Not Expressed in Monoaminergic Nuclei at 2 dpf. Results were all obtained using ISH. (A–D) hcrtr is expressed in the brain and spinal cord. (A) Lateral view of hcrtr expression in telencephalon (t), hypothalamus (ht), hypophysis (hp), posterior tuberculum (pt), and ventral rhombomere 2 (r2). (B) Dorsal view of hcrtr expression in the same structures. (C) Lateral view of spinal cord hcrtr expression. (D) Dorsal view of spinal cord (sc) hcrtr expression. Note the expression at the periphery of the spinal cord. Limits between somatic muscles and spinal cord tissue are indicated by black arrowheads. (E–J) Two-color ISH, flat mounts. (E) Lateral view of a hemi-brain stained for hcrtr (blue) and tyrosine hydroxylase (th, red); locus coeruleus (lc) is indicated by a white arrowhead; dopaminergic clusters by black arrowheads. (F) Lateral view of a hemi-brain stained for hcrtr (blue) and dopamine transporter (dat, red). (G) Lateral view of hemi-brain stained for hcrtr (blue) and dopamine beta hydroxylase (dbh, red). (H) Lateral close-up showing the absence of hcrtr expression in dopaminergic cells. (I) Lateral close-up showing absence of hcrtr expression in the locus coeruleus. (J) Dorsal close-up confirming absence of colocalization in the locus coeruleus. (K–S) Double fluorescent ISH, confocal microscopy pictures (stacks of 0.5- or 1-μm sections). (K and L) Lateral view of a hemi-brain stained for tyrosine hydroxylase (K) (th, green) and hcrtr (L) (red). (M) Merged view; note absence of yellow, indicating no colocalization. (N–P) From boxed area in (M), close-up of the diencephalic dopaminergic region and absence of hcrtr colocalization (P). (Q–S) From boxed area in (M), close-up on the locus coeruleus region and absence of hcrtr colocalization (S). (T) Lateral view of a flat-mounted hemi-brain stained for hcrtr (blue) and histidine decarboxylase (hdc, red). Note absence of colocalization. (U and V) Flat mounts. Lateral (hemi-brain) and ventral views of embryos stained for hcrtr (blue) and tryptophan hydroxylase 1 (tph1) (U) and tph2 (V), respectively. Note absence of colocalization. EXPRESSION / LABELING:
|

hcrtr Is Expressed in Neither the Posterior Diencephalic Dopaminergic Cells nor the Locus Coeruleus of Adult Zebrafish Brain. The topmost panels display lateral views of zebrafish adult brains with transversal plane corresponding to sections presented below. Results were all obtained using ISH. (A–C) hcrtr mRNA is expressed in the periventricular gray zone of optic tectum (pgz), periventricular nucleus of the posterior tuberculum (tpp), posterior tuberal nucleus (ptn), and ventral zone of periventricular hypothalamus (hv) of the anterior diencephalon (A). In the posterior diencephalon (B), hcrtr mRNA is mainly detected in the periventricular gray zone of optic tectum, medial preglomerular nucleus (pgm), and hypophysis (hp). hcrtr has a sparse expression in the anterior rhombencephalon (C), including the griseum centrale (gc) near the locus coeruleus. (D–F) th, dat, and dbh expression patterns in sections similar to those shown in (A–C), respectively. th is expressed in posterior tuberal nucleus and ventral zone of periventricular hypothalamus and in the torus longitudinalis (tl) (D). dat expression is restricted to a few posterior tuberal nucleus cells in the posterior diencephalon (E). dbh is expressed in the locus coeruleus (lc) (F). (G–I) Double ISH on equivalent sections showing colocalization of hcrtr (blue) with th (red) in the anterior catecholaminergic/dopaminergic cells of the diencephalon (G), absence of colocalization of hcrtr (blue) with dat (red) in the posterior catecholaminergic/dopaminergic cells of the diencephalon (H), and absence of colocalization of hcrtr (blue) with dbh (red) in the catecholaminergic/noradrenergic locus coeruleus (I). EXPRESSION / LABELING:
|
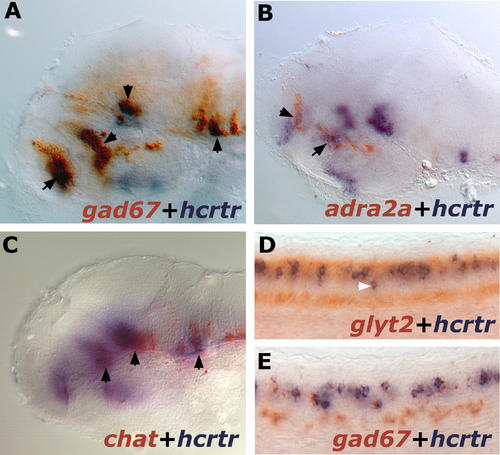
hcrtr Coexpression with GABAergic, Adrenergic, Cholinergic, and Glycinergic Systems in 2-dpf Larvae. Results were all obtained using ISH. (A) Lateral view of a flat-mounted hemi-brain stained for hcrtr (blue) and gad67 (red). Note multiple areas of overlap indicated by black arrowheads. (B) Lateral view of a flat-mounted hemi-brain stained for hcrtr (blue) and adra2a (red). Double staining in the anterior hypothalamus and telencephalon is indicated by arrowheads. (C) Lateral view of a flat-mounted hemi-brain stained for hcrtr (blue) and chat (red). Double-stained regions are indicated by black arrowheads. (D) Lateral views of spinal cord stained for hcrtr (blue) and glyt2 (red). Note that most hcrtr neurons but not all (white arrowhead) are glycinergic. (E) Lateral views of spinal cord stained for hcrtr (blue) and gad67 (red). Note that all hcrtr neurons are GABAergic. EXPRESSION / LABELING:
|

A Population of Anterior Hypothalamic hcrtr-Positive Neurons is adra2a- and gad67-Positive. The topmost panels display lateral views of zebrafish adult brain with transversal plane corresponding to sections presented below. Results were all obtained using ISH. (A–I) Single ISH expression patterns of hcrtr (A–C), adra2a (D–F), and gad67 (G–I) in the anterior diencephalon. In the most rostral part of the diencephalon, hcrtr is mainly expressed in the ventral thalamic nucleus (vtn) and the ventral zone of the periventricular hypothalamus (hv) (A and B). Posteriorly, it is mostly expressed in the peripheral gray zone and in periventricular areas including the central posterior thalamic nucleus (cp) and the ventral zone of the periventricular hypothalamus. (J–L) Double ISH showing colocalization of hcrtr and adra2a in the ventral zone of the periventricular hypothalamus (arrowheads). (M–O) Double ISH showing colocalization of hcrtr and gad67 in the ventral zone of the periventricular hypothalamus and ventral thalamic nucleus (arrowheads). (P–R) Double ISH showing colocalization of gad67 and adra2a in the ventral zone of the periventricular hypothalamus (arrowheads). Note that hcrtr, gad67, and adra2a only colocalize in the anterior hypothalamus and not in the posterior ventral zone of the periventricular hypothalamus, where gad67 is absent (I). Posterior to this area, only the central thalamic nucleus expresses these three markers (last column). EXPRESSION / LABELING:
|

hcrtr Does Not Colocalize with the Cholinergic System in the Telencephalon and Rhombencephalon. The topmost panels display lateral views of zebrafish adult brains with transversal planes corresponding to sections presented below. Results were all obtained using ISH with chat and hcrtr. (A) Cholinergic neurons were not detected in the adult zebrafish telencephalon using chat or vacht (data not shown). In this area, hcrtr is strongly expressed in the commissural nucleus of the ventral telencephalic area (cv) and the anterior part of the parvocellular preoptic nucleus (ppa). (B and C) Major clusters of cholinergic neurons are present in the periventricular gray zone (pgz) ([B], panel 1), the nucleus of the medial longitudinal fascicle (nmlf) ([B], panel 2), the perilemniscal nucleus (pl) ([B], panel 3), the dorsal zone of periventricular hypothalamus (hd) ([B], panel 4), and the nucleus lateralis valvulae (nlv) (C). Coexpression with hcrtr was mostly observed in the periventricular gray zone ([B], panel 1) and in the dorsal zone of periventricular hypothalamus ([B], panel 4). (D–G) A careful survey of the rhombencephalon failed to reveal coexpression of hcrtr with chat-positive neurons, including in the peri-locus coeruleus area. EXPRESSION / LABELING:
|

Sleep-Wake Patterns in hcrtr168 Mutants versus Wild-Type Recordings were performed using the AFSRS over 48 h after 3 d of habituation. Data are plotted every 2 h. (Wild-type, n = 22; homozygous mutant, n = 17). (A) Activity patterns. Note slightly increased activity (+20%) in mutant fish during the night. (B) Percent sleep per hour. Note decreased sleep amounts (-30%) in mutant fish during the entire night. (C) Mean wake bout length per hour (calculated as the mean period length of the non-sleep periods each hour) is similar in both genotypes. (D) Mean sleep bout length per hour. Note dramatic decrease in sleep bout length (-65%) during the night in mutant animals. (E) The number of sleep-wake transitions per hour increases dramatically in hcrtr168 mutants during the night (+60%). For overall means of these parameters across the dark and light periods, and during other light cycles, see Table 1. PHENOTYPE:
|