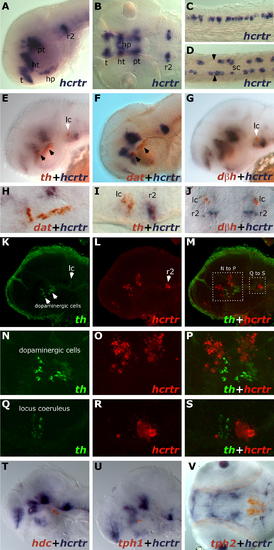
hcrtr Is Not Expressed in Monoaminergic Nuclei at 2 dpf. Results were all obtained using ISH. (A–D) hcrtr is expressed in the brain and spinal cord. (A) Lateral view of hcrtr expression in telencephalon (t), hypothalamus (ht), hypophysis (hp), posterior tuberculum (pt), and ventral rhombomere 2 (r2). (B) Dorsal view of hcrtr expression in the same structures. (C) Lateral view of spinal cord hcrtr expression. (D) Dorsal view of spinal cord (sc) hcrtr expression. Note the expression at the periphery of the spinal cord. Limits between somatic muscles and spinal cord tissue are indicated by black arrowheads. (E–J) Two-color ISH, flat mounts. (E) Lateral view of a hemi-brain stained for hcrtr (blue) and tyrosine hydroxylase (th, red); locus coeruleus (lc) is indicated by a white arrowhead; dopaminergic clusters by black arrowheads. (F) Lateral view of a hemi-brain stained for hcrtr (blue) and dopamine transporter (dat, red). (G) Lateral view of hemi-brain stained for hcrtr (blue) and dopamine beta hydroxylase (dbh, red). (H) Lateral close-up showing the absence of hcrtr expression in dopaminergic cells. (I) Lateral close-up showing absence of hcrtr expression in the locus coeruleus. (J) Dorsal close-up confirming absence of colocalization in the locus coeruleus. (K–S) Double fluorescent ISH, confocal microscopy pictures (stacks of 0.5- or 1-μm sections). (K and L) Lateral view of a hemi-brain stained for tyrosine hydroxylase (K) (th, green) and hcrtr (L) (red). (M) Merged view; note absence of yellow, indicating no colocalization. (N–P) From boxed area in (M), close-up of the diencephalic dopaminergic region and absence of hcrtr colocalization (P). (Q–S) From boxed area in (M), close-up on the locus coeruleus region and absence of hcrtr colocalization (S). (T) Lateral view of a flat-mounted hemi-brain stained for hcrtr (blue) and histidine decarboxylase (hdc, red). Note absence of colocalization. (U and V) Flat mounts. Lateral (hemi-brain) and ventral views of embryos stained for hcrtr (blue) and tryptophan hydroxylase 1 (tph1) (U) and tph2 (V), respectively. Note absence of colocalization.
|
