
Fig. 6 - Supplemental 5
- ID
- ZDB-FIG-250204-41
- Publication
- Sun et al., 2024 - Target protein identification in live cells and organisms with a non-diffusive proximity tagging system
- Other Figures
-
- Fig. 1
- Fig. 1 - Supplemental 1
- Fig. 1 - Supplemental 2
- Fig. 1 - Supplemental 3
- Fig. 2
- Fig. 2 - Supplemental 1
- Fig. 2 - Supplemental 2
- Fig. 2 - Supplemental 3
- Fig. 2 - Supplemental 4
- Fig. 3
- Fig. 3 - Supplemental 1
- Fig. 3 - Supplemental 2
- Fig. 3 - Supplemental 3
- Fig. 4
- Fig. 4 - Supplemental 1
- Fig. 4 - Supplemental 2
- Fig. 4 - Supplemental 3
- Fig. 4 - Supplemental 4
- Fig. 4 - Supplemental 5
- Fig. 4 - Supplemental 6
- Fig. 4 - Supplemetal 7
- Fig. 5
- Fig. 6
- Fig. 6 - Supplemental 1
- Fig. 6 - Supplemental 2
- Fig. 6 - Supplemental 3
- Fig. 6 - Supplemental 4
- Fig. 6 - Supplemental 5
- Fig. 6 - Supplemental 6
- Fig. 7
- Fig. 7 - Supplemental 1
- All Figure Page
- Back to All Figure Page
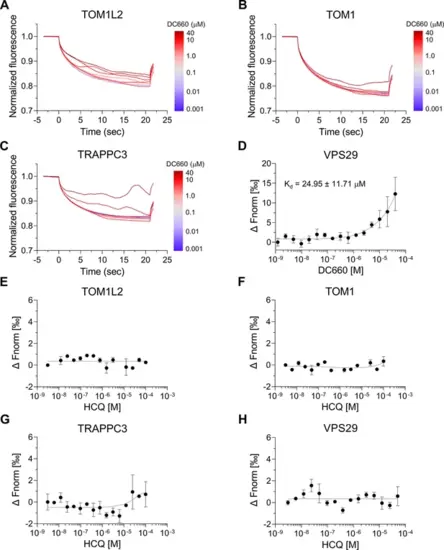
Microscale thermophoresis (MST) binding analysis of candidate proteins identified with DC661-H1. (A–C) Thermophoretic movement of DC660 bound to purified target proteins labeled with Cy5 dye. TOM1L2, TOM1, and TRAPPC3 exhibited ligand-induced aggregation, suggesting their interaction with DC660. (D–H) Dose–response curves of normalized fluorescence changes for target proteins binding. VPS29 demonstrated substantial affinity to DC660 with a Kd of 24.95 ± 11.71 µM (D), but showed no binding to HCQ (H). TOM1L2, TOM1, and TRAPPC3 did not show detectable binding to HCQ (E–H). n = 2. Data are shown as mean ± s.d. |