
Fig. 5
- ID
- ZDB-FIG-250204-35
- Publication
- Sun et al., 2024 - Target protein identification in live cells and organisms with a non-diffusive proximity tagging system
- Other Figures
-
- Fig. 1
- Fig. 1 - Supplemental 1
- Fig. 1 - Supplemental 2
- Fig. 1 - Supplemental 3
- Fig. 2
- Fig. 2 - Supplemental 1
- Fig. 2 - Supplemental 2
- Fig. 2 - Supplemental 3
- Fig. 2 - Supplemental 4
- Fig. 3
- Fig. 3 - Supplemental 1
- Fig. 3 - Supplemental 2
- Fig. 3 - Supplemental 3
- Fig. 4
- Fig. 4 - Supplemental 1
- Fig. 4 - Supplemental 2
- Fig. 4 - Supplemental 3
- Fig. 4 - Supplemental 4
- Fig. 4 - Supplemental 5
- Fig. 4 - Supplemental 6
- Fig. 4 - Supplemetal 7
- Fig. 5
- Fig. 6
- Fig. 6 - Supplemental 1
- Fig. 6 - Supplemental 2
- Fig. 6 - Supplemental 3
- Fig. 6 - Supplemental 4
- Fig. 6 - Supplemental 5
- Fig. 6 - Supplemental 6
- Fig. 7
- Fig. 7 - Supplemental 1
- All Figure Page
- Back to All Figure Page
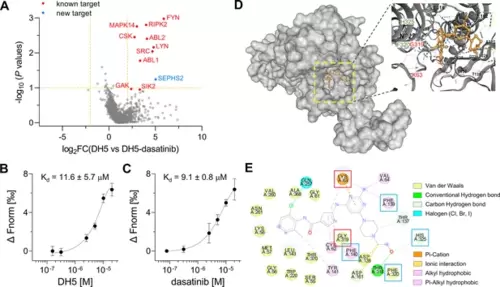
Target-ID by POST-ITDH5. (A) Volcano plot displaying the relative fold change (FC) of DH5-binding proteins compared to those with dasatinib competition. Known target proteins for dasatinib were highlighted in red, and a newly identified target protein, SEPHS2, was marked in blue. (B, C) Microscale thermophoresis (MST) analysis demonstrates a direct interaction between DH5 and Cy5-labeled SEPHS2 (B) or between dasatinib and Cy5-labeled SEPHS2 (C), yielding Kd values of 11.6 ± 5.7 µM and 9.1 ± 0.8 µM, respectively. n = 2. Data are shown as mean ± s.d. (D) Molecular docking binding pose between dasatinib and SEPHS2. The yellow box indicates the binding pocket, expanded for a closer view. The binding pocket of dasatinib precisely fits into the active sites of SEPHS2. (E) Diagram of 2D molecular docking interaction between SEPHS2 and dasatinib. Red boxes highlight the active sites, and blue boxes indicate residues among HUB nodes. |